Weekly Technical Trade Levels on USD Majors, Commodities & Stocks
- Technical setups we’re tracking into the weekly/ yearly open
- Next Weekly Strategy Webinar: Monday, January 29 at 8:30am EST
- Review the latest Weekly Strategy Webinars on my YouTube playlist.
In this webinar we take an in-depth look at the technical trade levels for the US Dollar (DXY), Euro (EUR/USD), British Pound (GBP/USD), Canadian Dollar (USD/CAD), Japanese Yen (USD/JPY), Australian Dollar (AUD/USD), Swiss Franc (USD/CHF), Gold (XAU/USD), Silver (XAG/USD), Crude Oil (WTI), S&P 500 (SPX500), Nasdaq (NDX), Dow Jones (DJI) and Bitcoin (BTC/USD). These are the levels that matter on the technical charts heading into the weekly open.
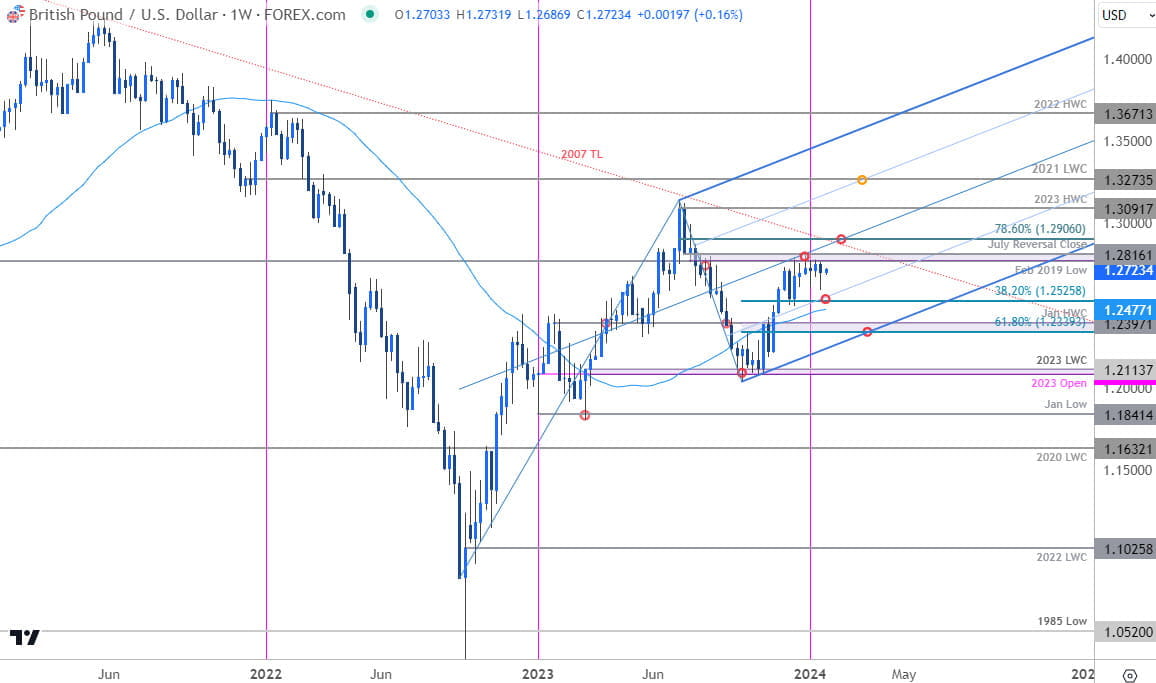
British Pound Price Chart – GBP/USD Weekly

Chart Prepared by Michael Boutros, Sr. Technical Strategist; GBP/USD on TradingView
The January opening-range is preserved just below key resistance at 1.2273-1.2816- looking for the breakout to offer guidance here. Levels are unchanged with initial weekly support eyed at 1.2525 backed by broader bullish invalidation at 1.2339/97. Ultimately a topside breach / weekly close above the 1.29-handle would be needed to mark uptrend resumption. Review my latest GBP/USD Short-term Technical Outlook for a closer look at the near-term Sterling trade levels.
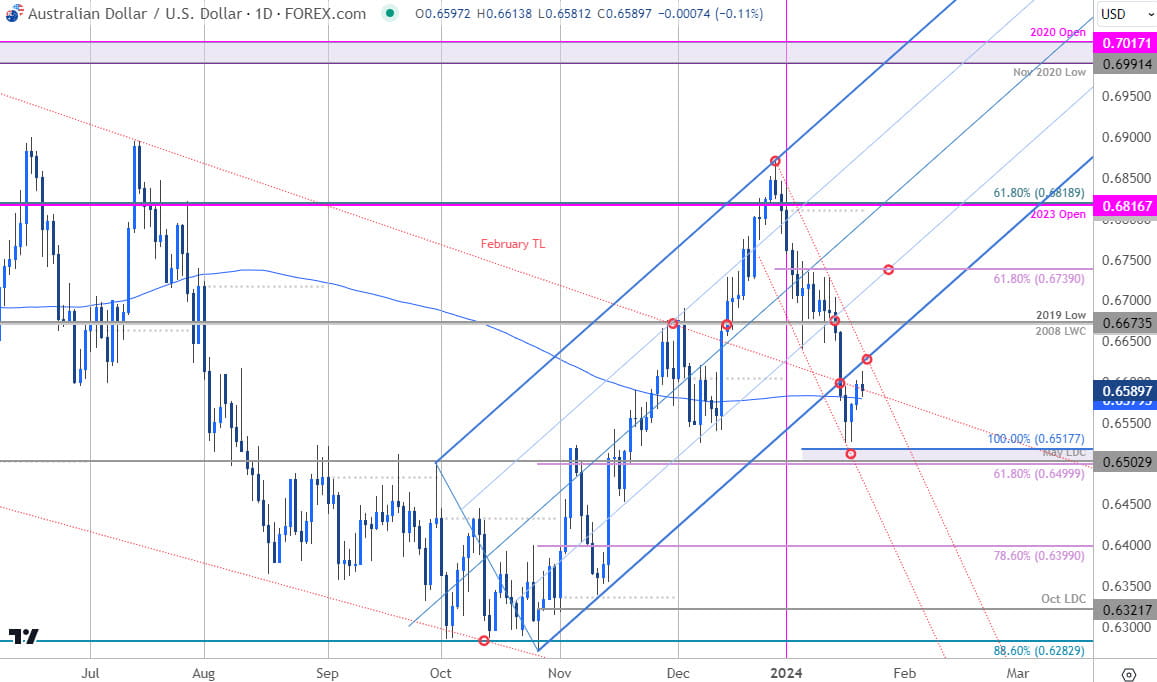
Australian Dollar Price Chart - AUD/USD Daily

Chart Prepared by Michael Boutros, Sr. Technical Strategist; AUD/USD on TradingView
Aussie broke the monthly opening-range lows last week with the decline turning just ahead of confluent support at 6500/18. IF this break of the October rally is legitimate, rallies should be capped by the highlighted trendline confluence near 6630s. Risk for topside exhaustion while within this channel formation. Review my latest Australian Dollar Short-term Outlook for a closer look at the AUD/USD near-term technical trade levels.
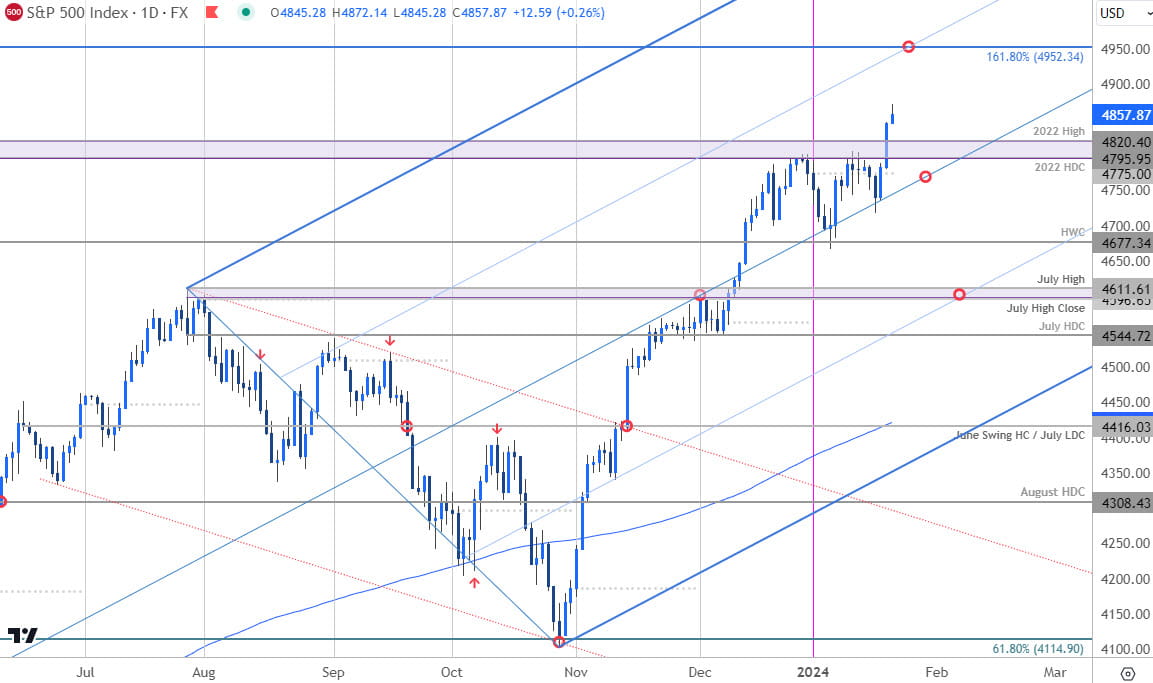
S&P 500 Price Chart – SPX500 Daily

Chart Prepared by Michael Boutros, Technical Strategist; SPX500 on TradingView
The S&P 500 broke above the January opening-range highs / key resistance last week and keeps the index constructive while above 4795-4820. Near-term bullish invalidation now raised to the objective monthly-open at 4775. Subsequent technical considerations on the topside are eyed at 4900 and the 1.618% Fibonacci extension of the 2022 advance at 4948.
Economic Calendar – Key USD Data Releases

Economic Calendar - latest economic developments and upcoming event risk.
--- Written by Michael Boutros, Sr Technical Strategist with FOREX.com
Follow Michael on X @MBForex


