Fundamental Analysis Talking Points:
- Fundamental analysis focuses on inputs in effort of projecting trends and future price movements.
- This can be great for idea generation but can be challenging from an execution standpoint, which will often motivate traders to incorporate technical analysis for further assistance. In this article, I broach the topic of fundamental analysis similar to what was discussed in the first installment of the Trader’s Course. This is a simplified explanation, but if you'd like the full installment that is linked below.
- The Trader’s Course has been launched and is available from the below link. The first three sections of the course are completely open and this focuses on fundamental analysis, technical analysis and price action.
There are several ways to go about finding trades or setups in the Forex market, and one popular route is through fundamental analysis. This involves investigation of an economy and focusing on inputs in effort of projecting how that economy may perform in the future. While this will have a slightly different look or feel than equity markets, where the focus is often on cash flows, market share and balance sheets of an individual companies, a macro-economy has inputs such as employment, inflation, GDP and retail sales; all of which can provide context for how that economy has performed and perhaps more important, for how it may perform.
In this article, I’m going to recap some of the high points from the first installment of The Trader’s Course, where the focus is squarely on fundamental analysis. This aims to serve as a simple introduction to the topic. But, for the full discussion, you’re welcome to view that installment in its entirety and I’ve linked that in the video box below.
The Trader’s Course Part One: Fundamental Analysis
All About Rates
At its simplest, fundamental analysis in the Forex markets can be condensed down to interest rates; and perhaps more accurately stated, interest rate expectations are often a primary driver behind currency prices.
There is an actual impact from rates in spot Forex, however, and that can be dialed back to rollover, which is a daily interest credit or debit depending on the pair that’s being traded. These rates can be tracked on the following page: Rollover Rates from FOREX.com.
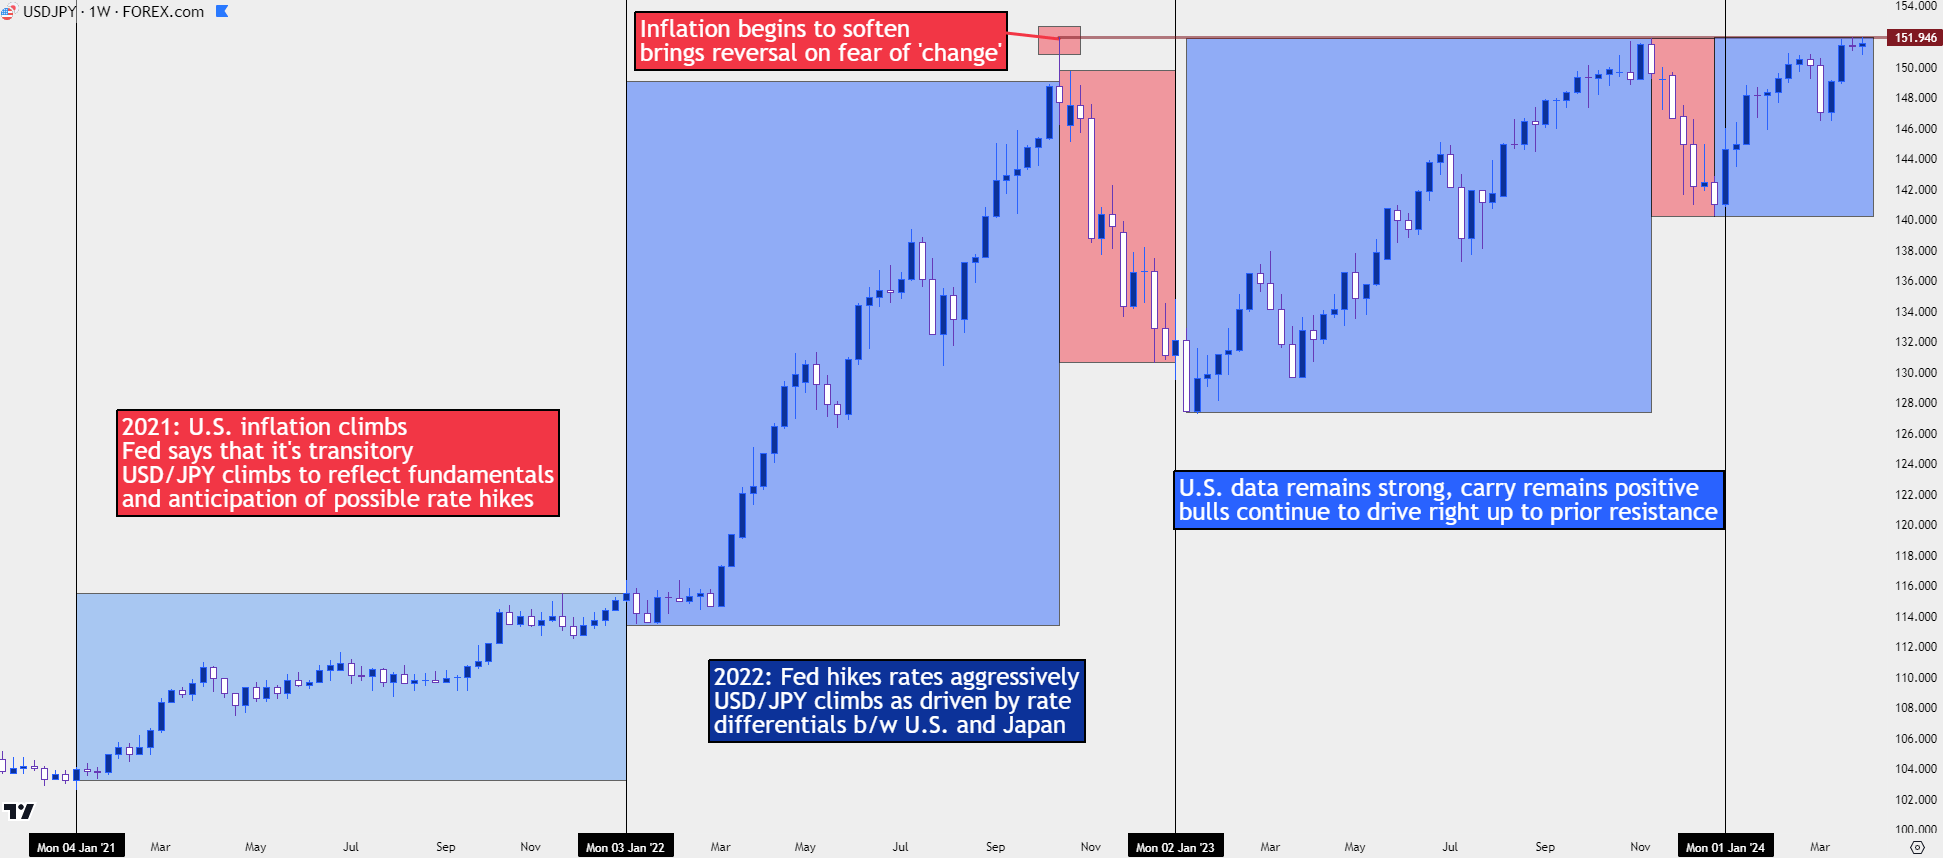
In the spot FX market traders can earn or pay rollover at the end of each trading day, determined by the rate differential of the pair that’s being traded. Take, for instance, the USD/JPY pair. The U.S. has been hiking interest rates for the past couple of years and that’s allowed for higher rates to the USD. Meanwhile, the Bank of Japan has been sitting on negative rates since 2007, until last month’s rate hike. So, as the U.S. continued to hike rates and the Bank of Japan did not, this created a growing disparity in the pair and traders holding long positions in USD/JPY had the opportunity to earn daily rollover payments.
This, of course, was attractive to market participants across the globe, and this helped to drive demand into the long side of the pair. And as demand heated up, creating a bullish trend, more traders joined the move, leading to more demand and even higher-highs. This is often called ‘the carry trade,’ and when it shows, it can drive significant trends in FX pairs.
USD/JPY Weekly Price Chart

Chart prepared by James Stanley, USD/JPY on Tradingview
You’ll probably notice that USD/JPY wasn’t always in a bullish trend over the past two years and this is because price action is not a direct manifestation of fundamentals. Fundamentals can and do impact price. But the day-to-day data prints are part of a larger picture that point towards rate expectations, and those changes in rate expectations can bring large changes into a market. In the example above in USD/JPY, the pullback in 2022 and 2023 was very much driven by weakness in U.S. data, bringing with it the hope for a ‘less hawkish’ FOMC.
Or another way to look at it: The threat of reversal came from data. And as U.S. inflation softened and as expectations continued to grow for the Fed to slow down rate hikes, those carry traders that had held long were increasingly incentivized to take profit and close the position.
And this speaks to the next point, which is that fundamentals can impact rate expectations which can then impact market trends. This explains why there’s so much focus on Central Bank rate decisions, particularly the Federal Reserve, as its those decisions that change rates. Those policymakers are looking at the day-to-day data point to form their views and opinions, thereby placing importance on those data points as market participants attempt to build expectations around what the Central Bank might do next.
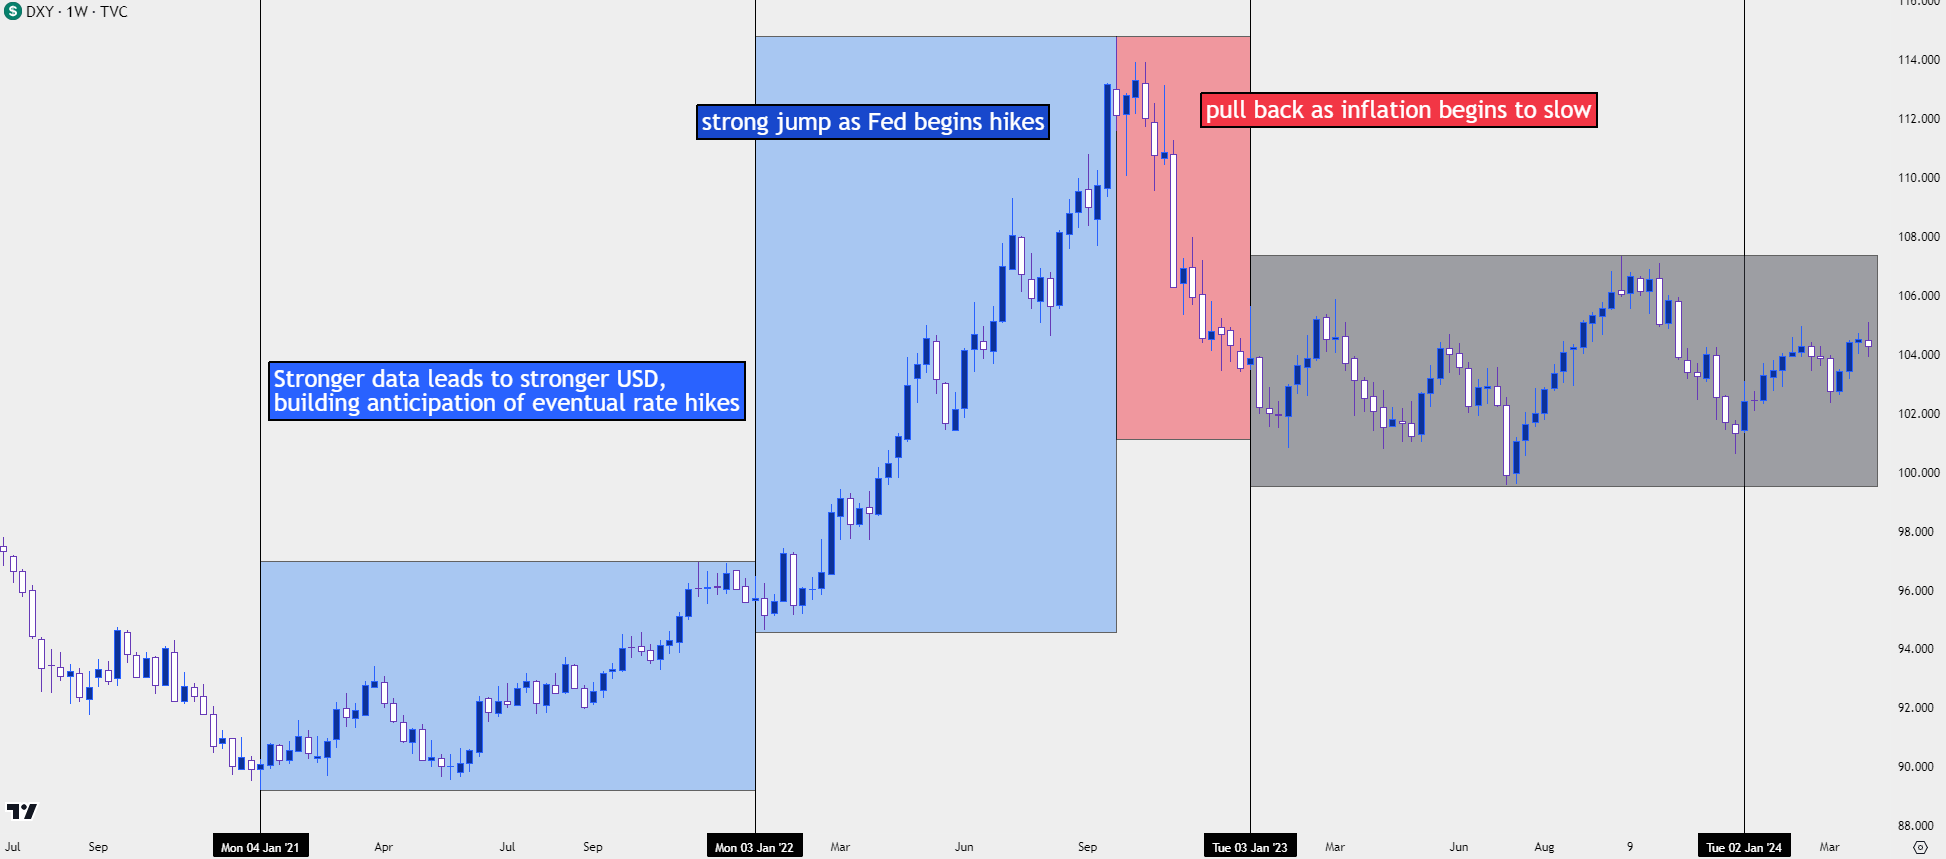
As an example, we can look into the U.S. Dollar since the 2021 open. During 2021, inflation continued to climb but the Fed continued to shrug it off, under the presumption that it was transitory and due to supply chain issues. They expected inflation to abate as supply chains came back online after Covid shutdowns, and we can see a bullish move pricing in that year as the data remained strong, even though the Fed didn’t seem too concerned.
This started to shift in late-2021 trade as inflation persistently continued to climb, and that led to the bank forecasting rate hikes in 2022 trade. Towards the end of 2021 we can see DXY bulls starting to drive and as we came into 2022, the U.S. Dollar market exploded-higher as the Fed actually began to hike rates while warning that more were on the way.
But the currency topped in September of that year and started to pull back. The reason for that is that inflation had started to soften, albeit slightly.
U.S. Dollar Weekly Price Chart

Chart prepared by James Stanley; data derived from Tradingview
How Data Impacts Rate Expectations
With interest rates a primary driver of FX, and data a primary driver of interest rates, the statement can be spanned so that data impacts FX markets.
This emanates from the fact that market participants are constantly trying to look around the next corner, anticipating what may be on the horizon so that they can position accordingly. In the United States, the Federal Reserve has a dual mandate which means they track both employment and inflation in effort of setting policy so that it’s restrictive enough to control inflation, but not so restrictive that it stifles growth and creates higher-than-desired unemployment.
This places immense importance on a couple of regular data releases in the United States. For the labor market, it’s the Non-farm Payrolls report that gets considerable attention each month. This is commonly issued on the first Friday of the month, and it contains a few important data points in the same report, with the headline number as the total number of non-farm jobs that were added in the most recently completed month. The report also contains the unemployment rate, an important barometer of labor market health in the U.S., along with Average Hourly Earnings, which speaks to inflation as worker’s wage growth.
The main attraction of the report is its early nature as it’s one of the first looks that market participants will get at the most recently completed month of economic activity in the U.S. If this report prints far from the expectation, either far below or far above, this can be an early warning sign of shifting economic conditions.
Thusly, this report will often drive volatility while garnering considerable attention across markets. However, one of the downsides of the early-nature of the release is noisy data and the headline number will be subject to revisions in following months.
On the inflation front, there’s two different reports of note: The Consumer Price Index remains a common focal point, but the Fed also tracks Personal Consumption Expenditures, or PCE, and this is often considered their preferred inflation gauge. These data points will often share some form of relationship but it’s important to remember that it’s not lockstep, and they can diverge as they are measuring inflation in different ways. But, collectively through these data points, market participants can begin to get an idea for economic performance while also building expectations for how the Central Bank may respond.
So, the simple relationship can be looked to as: Data helps to form expectations for future central bank actions, and that can then push market trends, which can then later be confirmed or rejected based on the actions of those central banks. That can the form trends, visibly displayed on the chart and if looking at the matter through price action, this will often lead to a series of higher-highs and higher-lows for up-trends, or a series of lower-lows and lower-highs for down-trends.
This leads into the conversation on technical analysis, where traders can then marry their ideas generated from fundamental analysis or fundamentally-driven trends, and then coalesce that with the reality of current market pricing. I’m going to link to the second installment of the Trader’s Course below, which extends the discussion from fundamental analysis.
The Trader’s Course Part Two – Fundamental Analysis
--- written by James Stanley, Senior Strategist


