Weekly Technical Trade Levels on USD Majors, Commodities & Stocks
- Technical setups we are tracking into the weekly open – BoC, ECB, NFPs on tap
- Next Weekly Strategy Webinar: Monday, June 7 at 8:30am EST
- Review the latest Weekly Strategy Webinars or Stream Live on my YouTube playlist.
In this webinar we take an in-depth look at the technical trade levels for the US Dollar (DXY), Euro (EUR/USD), British Pound (GBP/USD), 10yr Treasury Yields, Japanese Yen (USD/JPY), Australian Dollar (AUD/USD), Canadian Dollar (USD/CAD), Swiss Franc (USD/CHF), Gold (XAU/USD), Crude Oil (WTI), S&P 500 (SPX500), Nasdaq (NDX), and Dow Jones (DJI). These are the levels that matter on the technical charts heading into June trade.
British Pound Price Chart – GBP/USD Weekly

Chart Prepared by Michael Boutros, Sr. Technical Strategist; GBP/USD on TradingView
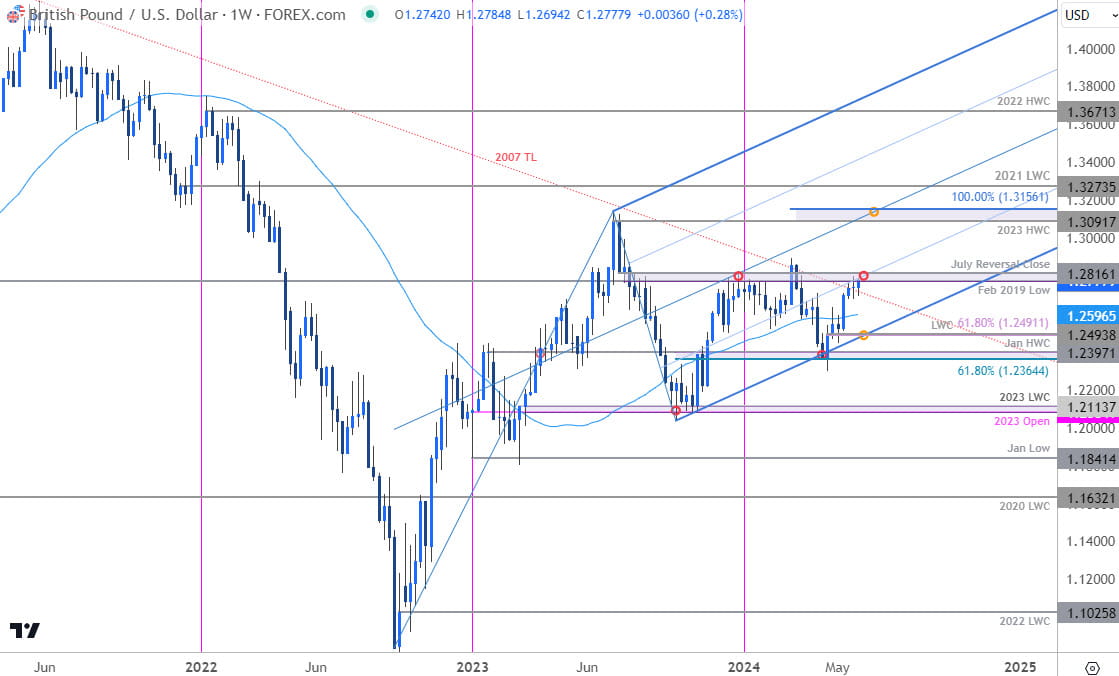
Sterling is testing major resistance for a second week at 1.2773-1.2816 – a region defined by the February 2019 low and the July reversal-close. We’re looking for a reaction / inflection off this zone into the start of the month with the long-bias vulnerable while below.
Initial support rests with the 52-week moving average (currently ~1.2597) backed by bullish invalidation at the yearly low-week close at 1.2493. A topside breach / weekly close above this key pivot zone is needed to mark uptrend resumption towards subsequent resistance objective at the yearly high-day close at 1.2857 and a major technical confluence at the high-week close (HWC) / 100% extension at 1.3091-1.3156.
Bottom line: Be on the lookout for possible exhaustion / price inflection up here – losses should be limited to 1.25 IF price is heading higher with a weekly close above 1.2816 needed to fuel the next major move in Sterling. I’ll publish an updated British Pound Short-term Outlook later this week.
US 10yr Treasury Yield – US10YR Weekly

Chart Prepared by Michael Boutros, Technical Strategist; US10Y on TradingView
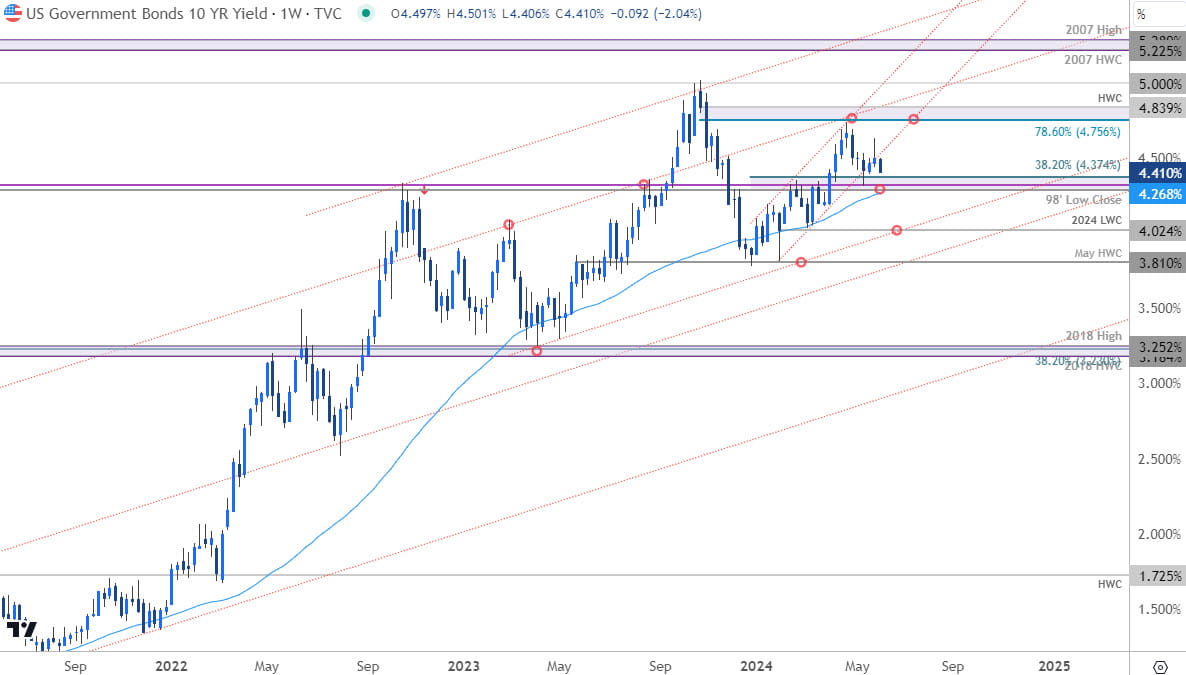
We highlighted yields on the US 10-year today and I’ve added a few levels of interest. The immediate focus is on a reaction into 4.27/37 IF reached – a region defined by the 52-week moving average, the 1998 low-close, the 61.8% retracement of the 2000 decline and a 38.2% retracement of the December rally.
A break / close below would threaten a test of key the yearly low-week close at 4.02 with broader bullish invalidation steady at 3.81. Key resistance remains unchanged at 4.75 with a breach / weekly close above the 2023 HWC at 4.84 needed to mark uptrend resumption.
Bottom line: IF this break of the December channel is legit, a close below the yearly moving average would be needed to validate / fuel the next leg. Keep an eye on USD/JPY this week as well with the downside accelerating in early US Trade (possible intervention).
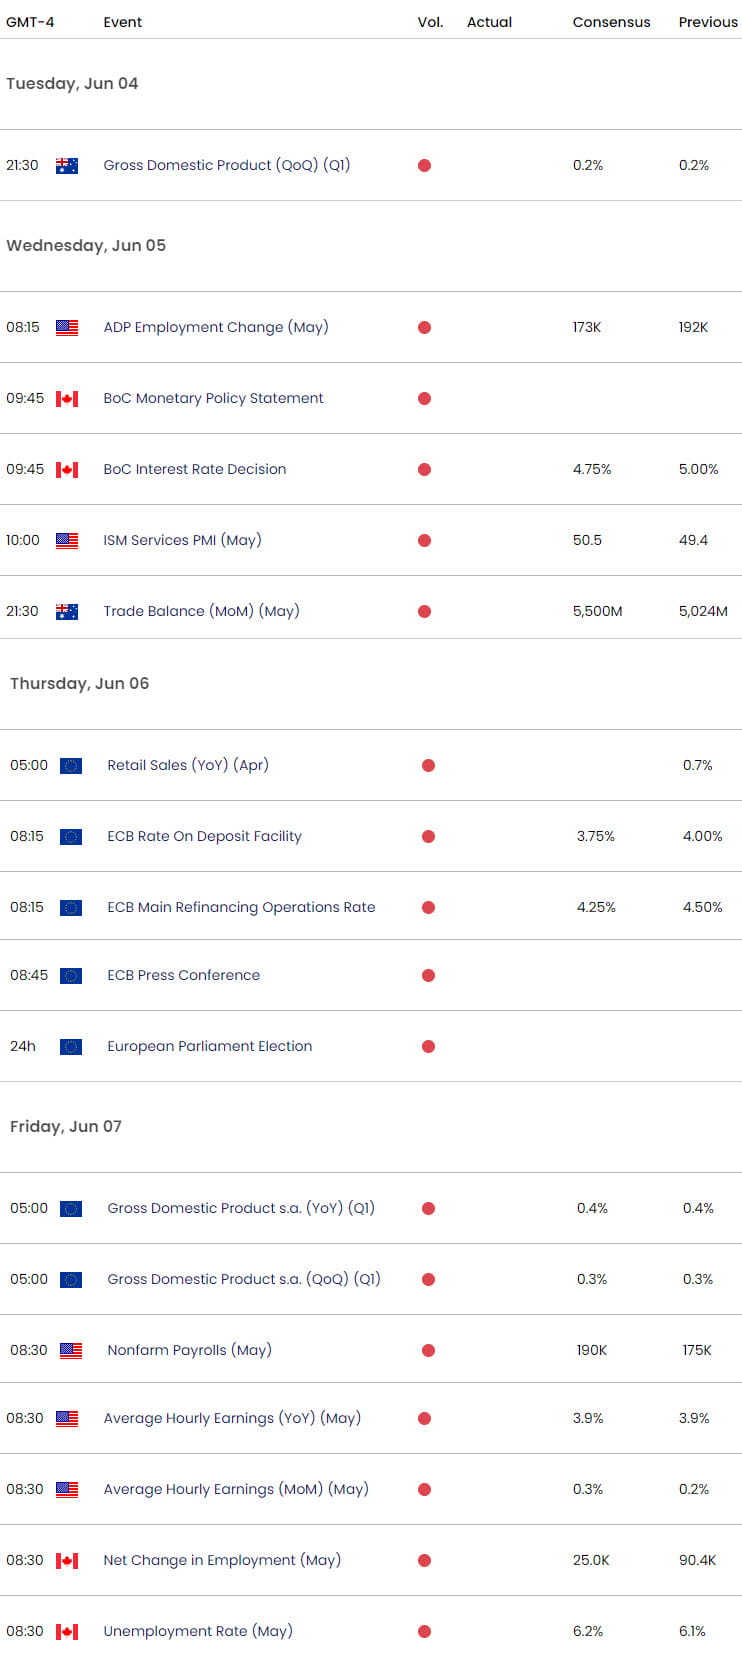
Highlighting the economic docket this week will be the BoC and ECB interest rate decisions with both central banks expected to cut rates by 25bps. The week rounds out with US Non-Farm Payrolls (NFP) and Canada employment on Friday- stay nimble into the June opening-range and watch the weekly closes for guidance here.
Economic Calendar – Key USD Data Releases

Economic Calendar - latest economic developments and upcoming event risk.
--- Written by Michael Boutros, Sr Technical Strategist with FOREX.com
Follow Michael on X @MBForex


