Weekly Technical Trade Levels on USD Majors, Commodities & Stocks
- Technical setups we are tracking into the weekly open – UK / Canada Inflation on tap
- Next Weekly Strategy Webinar: Tuesday, May 28 at 8:30am EST (Memorial Day Monday)
- Review the latest Weekly Strategy Webinars or Stream Live on my YouTube playlist.
In this webinar we take an in-depth look at the technical trade levels for the US Dollar (DXY), Euro (EUR/USD), British Pound (GBP/USD), Australian Dollar (AUD/USD), Canadian Dollar (USD/CAD), Japanese Yen (USD/JPY), Swiss Franc (USD/CHF), Gold (XAU/USD), Silver (XAG/USD), Crude Oil (WTI), S&P 500 (SPX500), Nasdaq (NDX), and Dow Jones (DJI). These are the levels that matter on the technical charts heading into the weekly open.
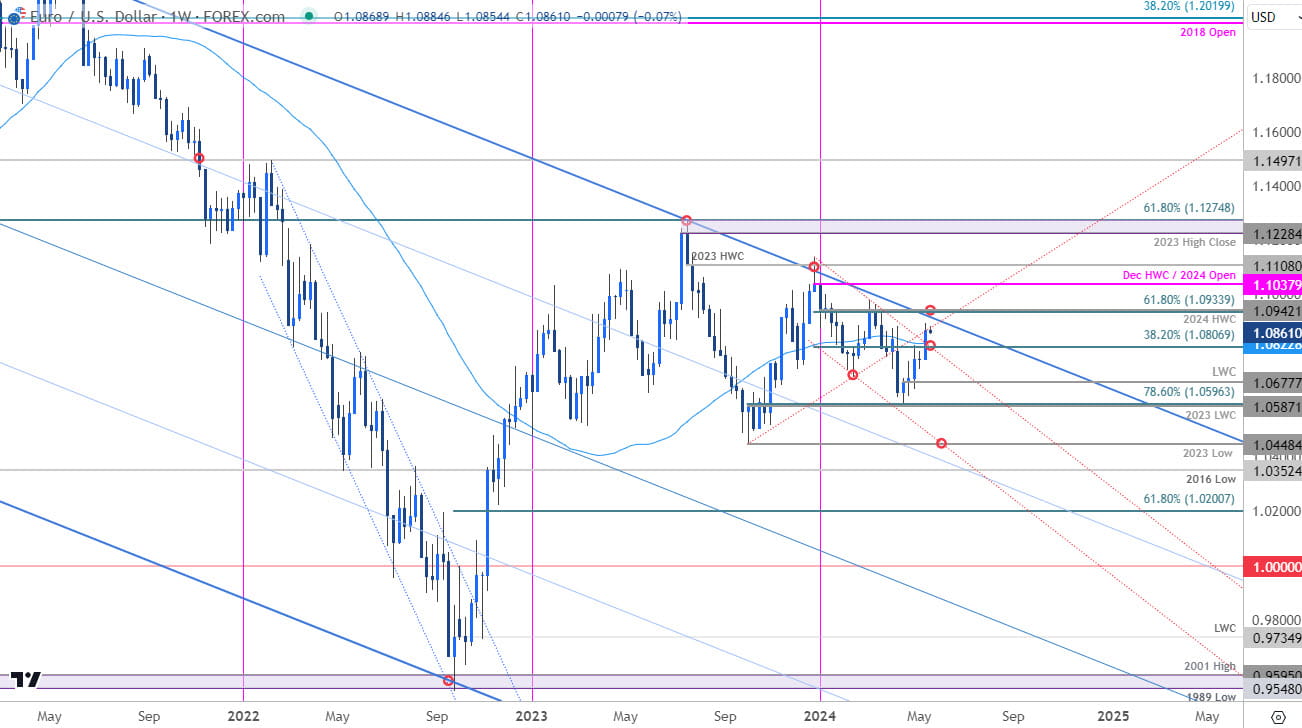
Euro Price Chart – EUR/USD Weekly

Chart Prepared by Michael Boutros, Sr. Technical Strategist; EUR/USD on TradingView
Euro broke above confluent resistance last week at “1.0806/19- a region defined by the 38.2% Fibonacci retracement of the December sell-off, the 52-week moving average, and basic trendline resistance.” The advance has stalled into the start of the week at former slope support (red) with the next key level of resistance eyed at the 2024 high-week close (HWC) / 61.8% retracement at 1.0942/33- looking for possible topside exhaustion / price inflection on a stretch into this zone IF reached. Support now rests back at the 1.08-handle with the yearly low-week close (LWC) at 1.0677 now key.
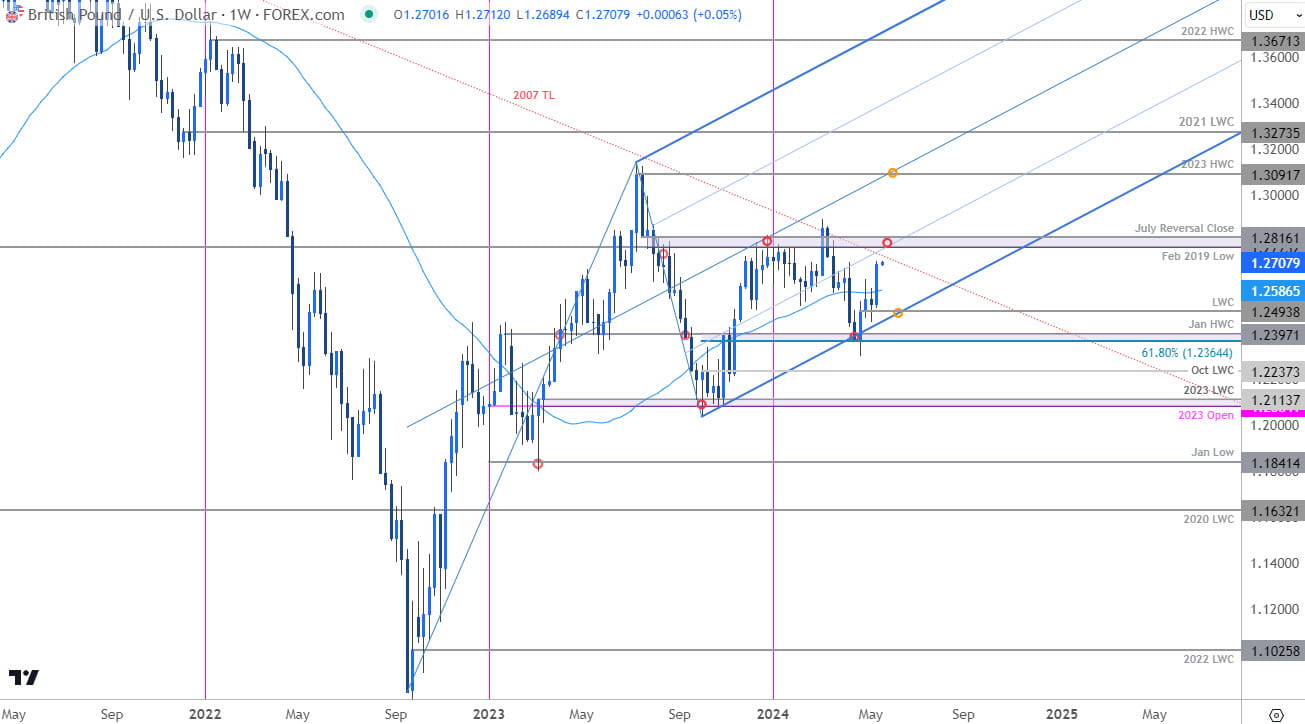
British Pound Price Chart – GBP/USD Weekly

Chart Prepared by Michael Boutros, Sr. Technical Strategist; GBP/USD on TradingView
Sterling has rallied more than 3.3% off the yearly lows with the advance now approaching longer-term technical considerations around 1.2773-1.2816 – a region defined by the February 2019 low and the July reversal close. Looking for a reaction on a possible stretch into this key zone for guidance with the risk for topside exhaustion in the days ahead.
Initial weekly support rests with the 52-week moving average (currently ~1.2586) backed by the yearly LWC at 1.2493- losses would need to be limited to this threshold for the broader 2022 advance to remain viable. A topside breach / close above key resistance would threaten a much more significant breakout towards the yearly highs around 1.2893 and the 2023 HWC at 1.3091.
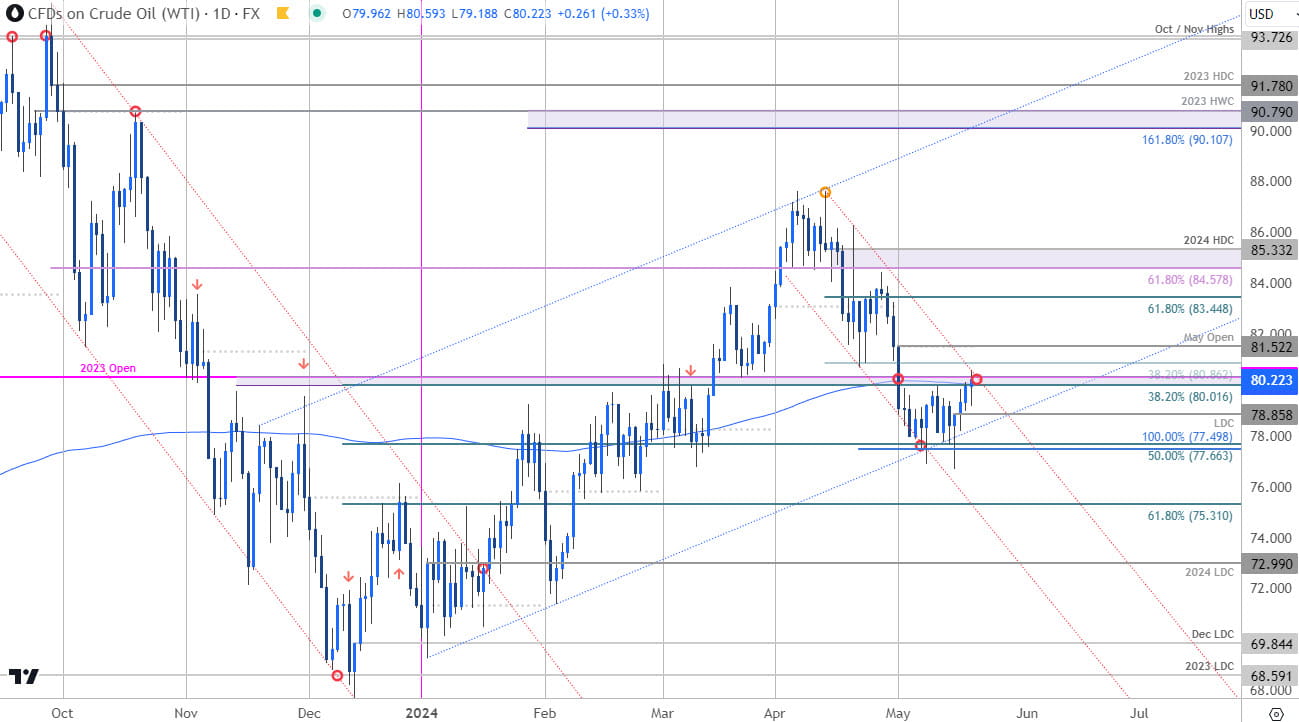
Oil Price Chart – WTI Daily (USOil)

Chart Prepared by Michael Boutros, Technical Strategist; WTI on TradingView
We highlighted this WTI setup last week and Oil is now trading into a critical pivot zone into the weekly open at 80.01/80.31- a region defined by the 38.2% retracement of the December rally, the 200-day moving average, and the 2023 yearly open. Looking for a reaction here with a breach / close above needed to suggest a more significant low was registered last week. Initial resistance objectives eyed at 80.86 and the objective monthly open at 81.52.
Losses should be limited to the May low-day close (LDC) at 78.85 IF price is heading higher on this stretch. Key support / bullish invalidation steady at the 100% extension of the April decline / the 50% retracement at 77.49/66. Review my latest Oil Price Forecast for a closer look at the longer-term WTI technical trade levels.
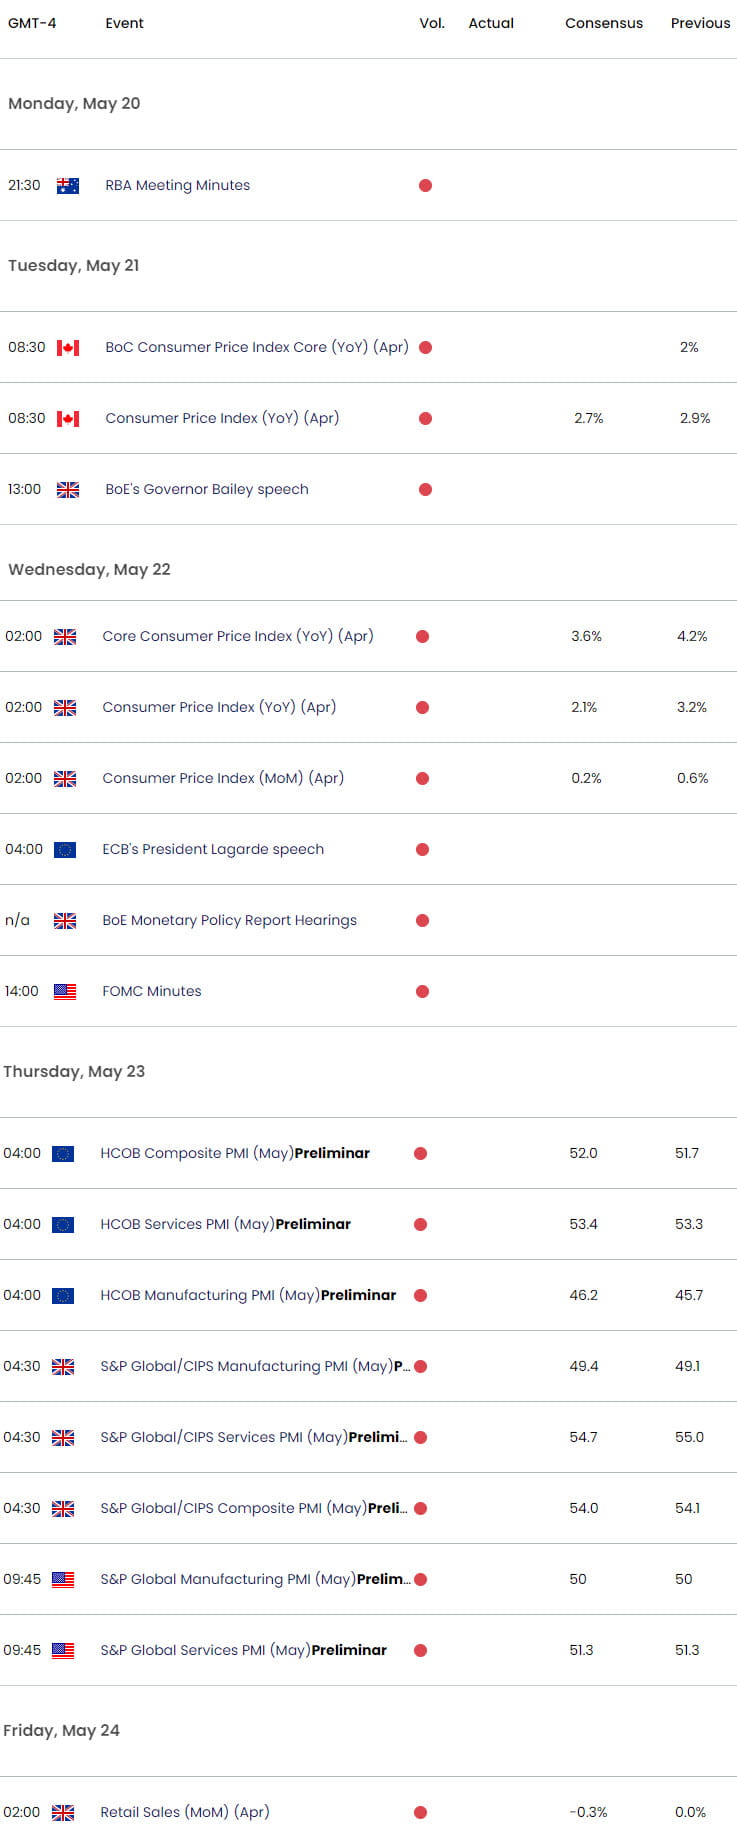
Economic Calendar – Key USD Data Releases

Economic Calendar - latest economic developments and upcoming event risk.
--- Written by Michael Boutros, Sr Technical Strategist with FOREX.com
Follow Michael on X @MBForex


