Weekly Technical Trade Levels on USD Majors, Commodities & Stocks
- Technical setups we’re tracking into the weekly open / FOMC
- Next Weekly Strategy Webinar: Monday, June 26 at 8:30am EST
- Review the latest Weekly Strategy Webinars on my YouTube playlist.
In this webinar we take an in-depth look at the technical trade levels for US Dollar (DXY), Euro (EUR/USD), British Pound (GBP/USD), Japanese Yen (USD/JPY), Canadian Dollar (USD/CAD), Australian Dollar (AUD/USD), Gold (XAU/USD), Silver (XAG/USD), S&P 500, Nasdaq, Dow Jones (DJI), Crude Oil (WTI) and EUR/JPY. These are the levels that matter heading into the FOMC this week.
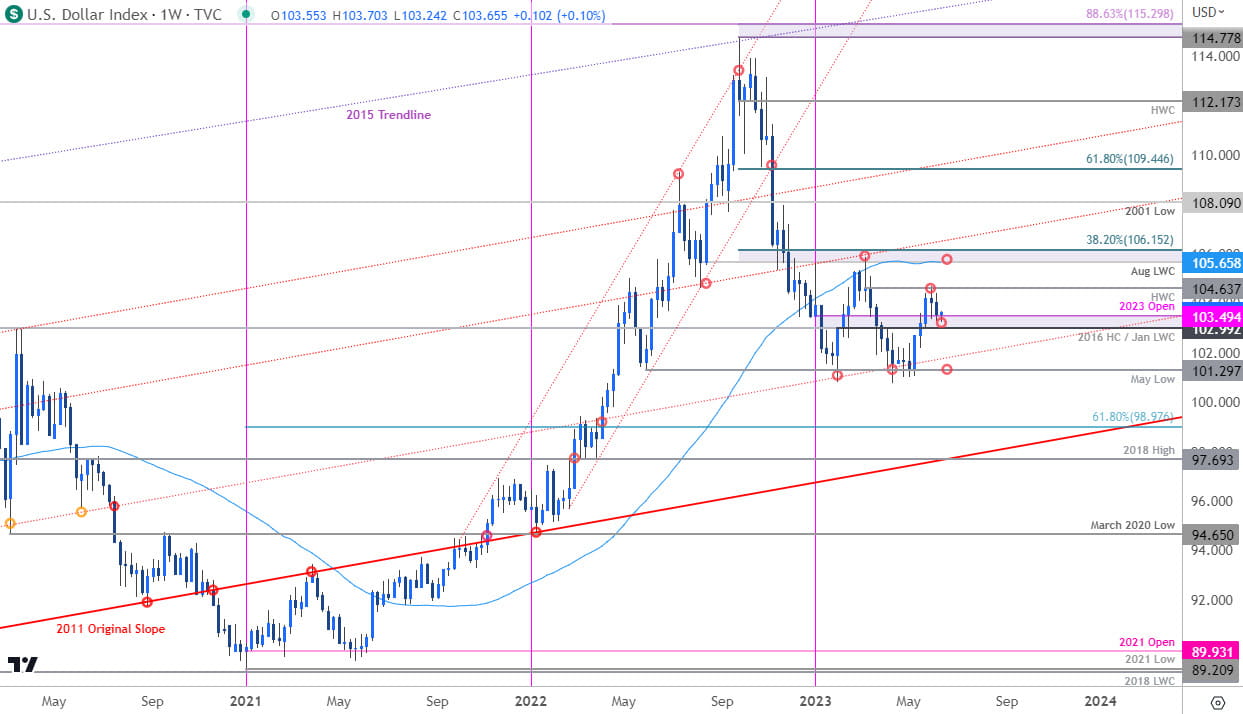
US Dollar Index Price Chart – DXY Weekly

Chart Prepared by Michael Boutros, Sr. Technical Strategist; DXY on TradingView
In last week’s Strategy Webinar we noted the US Dollar recovery was, “vulnerable near-term while below the objective yearly, high-week close at 104.64.” The index plunged nearly 1.4% off those highs with the decline now testing a critical pivot zone around 103- a region defined by the 2016 high-close, 2020 swing high and January low-week close. The focus is on a breakout of this key range heading into major event risk this week with US inflation on tap tomorrow ahead of the Fed interest rate decision. Watch the weekly close here. Review my latest US Dollar Technical Forecast for a closer look at the this technical setup.
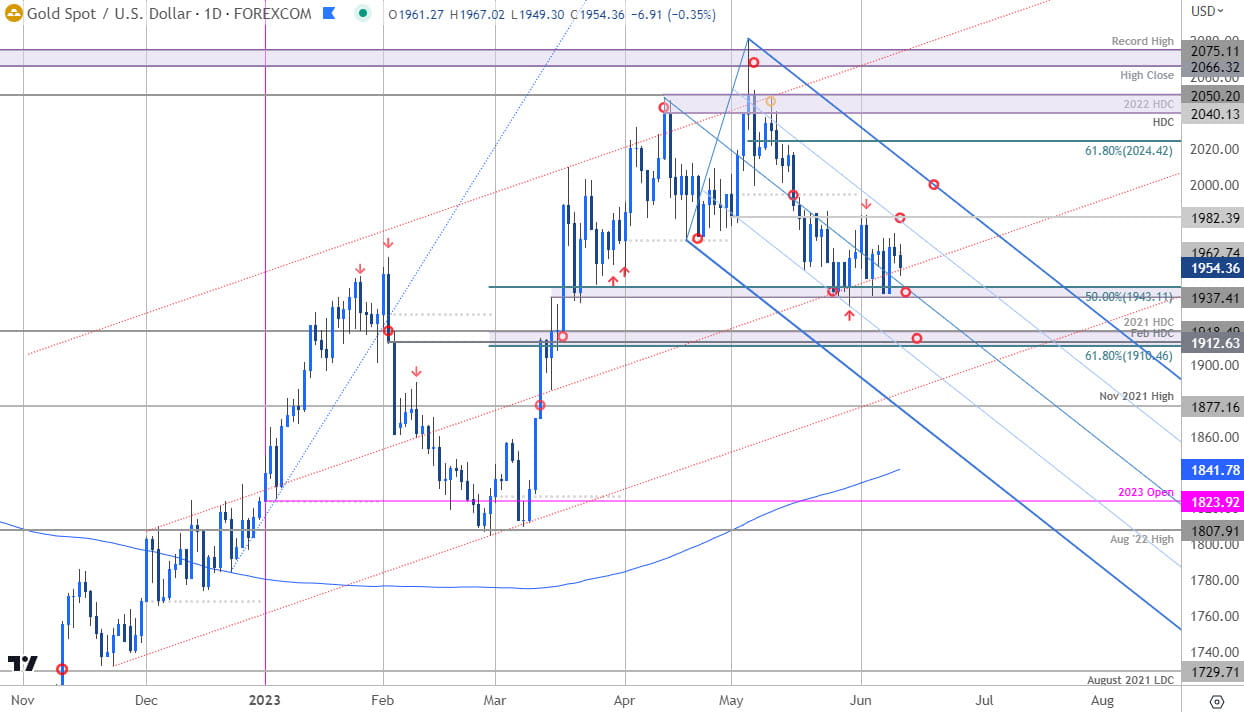
Gold Price Chart – XAU/USD Daily

Chart Prepared by Michael Boutros, Sr. Technical Strategist; XAU/USD on TradingView
Gold has now set the June opening-range just above support at 1937/43. Resistance stands at 1982 with a breach above pitchfork resistance (currently ~2000) needed to invalidate the May downtrend. A break below this support zone would expose a more significant technical confluence at 1910/18- a region defined by the 61.8% Fibonacci retracement of the yearly range, the February high-day reversal close and the 2021 high-day close. Look for a larger reaction there IF reached. Review my latest Gold Price Forecast for a closer look at the longer-term XAU/USD technical trade levels.
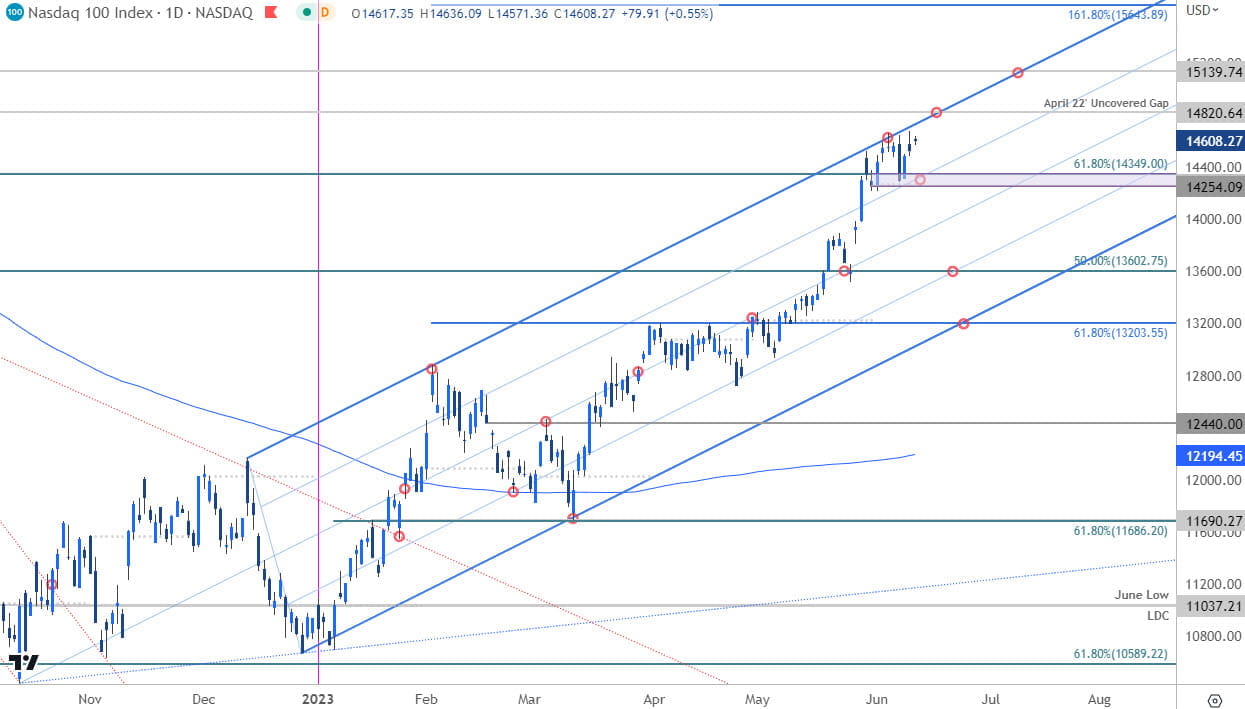
Nasdaq Price Chart – NDX Daily

Chart Prepared by Michael Boutros, Sr. Technical Strategist; Nasdaq on TradingView
Nasdaq has been trading into uptrend resistance for the past three-weeks with the June opening-range taking shape just below. The next major resistance hurdle is eyed at the April 2022 un-covered gap near 14820- look for a larger reaction there IF reached. Key support now rests with the monthly low-day close / 61.8% retracement of the 2021 decline at 14254/349- a close below this threshold would suggest a larger correction may be underway within the broader uptrend. Review my latest S&P 500, Nasdaq, Dow Technical Forecast for a closer look at the long-term Nasdaq trade levels.
--- Written by Michael Boutros, Sr Technical Strategist with FOREX.com
Follow Michael on Twitter @MBForex


