Weekly Technical Trade Levels on USD Majors, Commodities & Stocks
- Technical setups we are tracking into the weekly open– US CPI, Fed rate decision on tap
- Next Weekly Strategy Webinar: Monday, June 7 at 8:30am EST
- Review the latest Weekly Strategy Webinars or Stream Live on my YouTube playlist.
In this webinar we take an in-depth look at the technical trade levels for the US Dollar (DXY), 10yr Treasury Yields, Euro (EUR/USD), British Pound (GBP/USD), Japanese Yen (USD/JPY), Australian Dollar (AUD/USD), Canadian Dollar (USD/CAD), Swiss Franc (USD/CHF), Gold (XAU/USD), Crude Oil (WTI), S&P 500 (SPX500), Nasdaq (NDX), and Dow Jones (DJI). These are the levels that matter on the technical charts heading into the weekly open with US CPI and the FOMC interest rate decision on tap.
US Dollar Price Chart – USD Weekly (DXY)

Chart Prepared by Michael Boutros, Sr. Technical Strategist; DXY on TradingView
The US Dollar Index rebounded off key technical support last week 104.03/26 – a region defined by the 52-week moving average and the 38.2% retracement of the December rally. The rebound keeps USD within the confines of the December uptrend heading into the FOMC with bullish invalidation now raised to last week’s low.
Initial weekly resistance is eyed at the 2023 / 2024 high-week closes at 106.10/11- a breach / weekly close above this threshold is needed to fuel the next leg higher in price towards the 50% retracement and key resistance at 108.38/97.
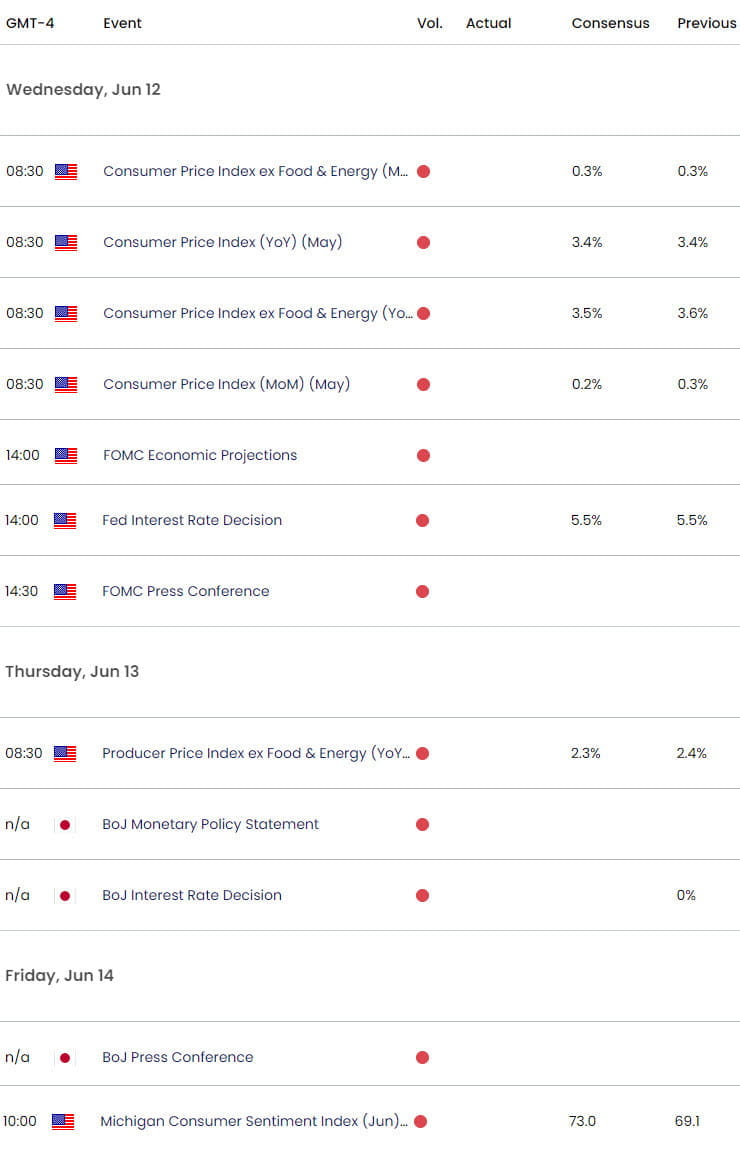
The May read of the US Consumer Price Index (CPI) is out just ahead of the FOMC interest rate decision on Wednesday with the BoJ on deck. Stay nimble into the releases and watch the weekly close here for guidance. I’ll publish an updated US Dollar Short-term Outlook once we get further clarity on the near-term DXY technical trade levels.
Gold Price Chart – XAU/USD Daily

Chart Prepared by Michael Boutros, Sr. Technical Strategist; XAU/USD on TradingView
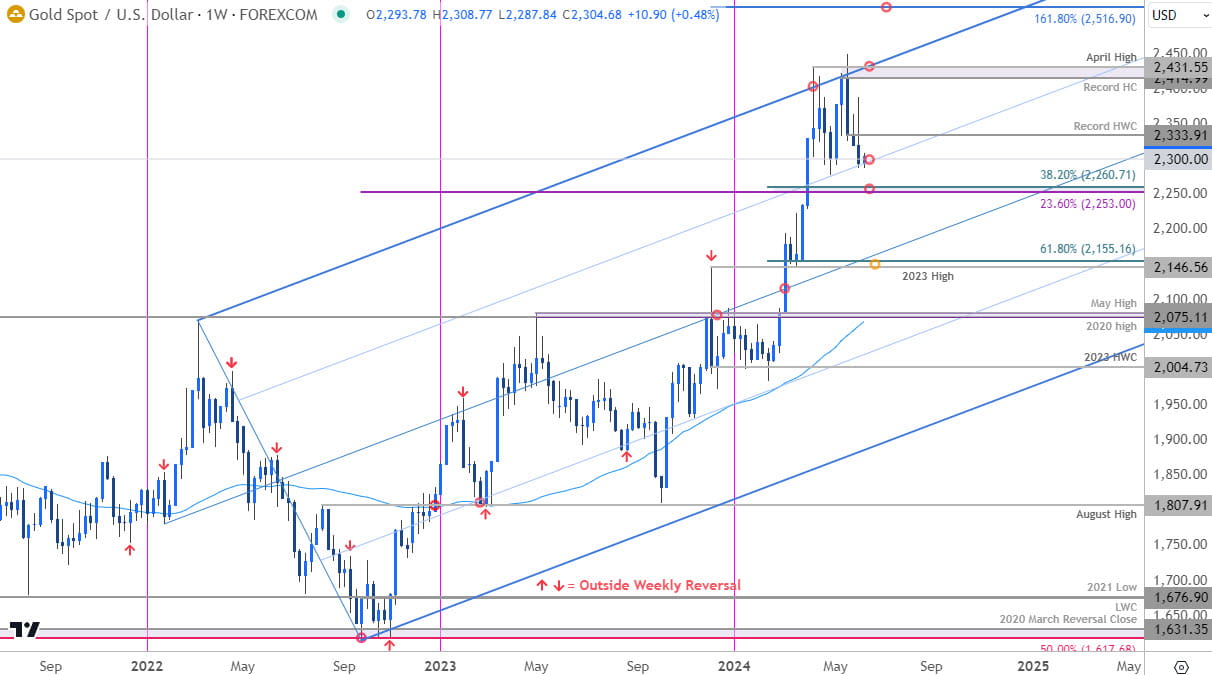
Gold is in focus heading into this week’s event risk with XAU/USD trading at support into the weekly open around 2300. The threat remains for a deeper pullback while below the high-week close (HWC) at 2334 with key support eyed at 2553/60- look for a larger reaction there IF reached. Expect some volatility here this week- again, watch the close for guidance. Review my latest Gold Technical Forecast for a closer look at these levels.
Economic Calendar – Key USD Data Releases

Economic Calendar - latest economic developments and upcoming event risk.
--- Written by Michael Boutros, Sr Technical Strategist with FOREX.com
Follow Michael on X @MBForex


