Weekly Technical Trade Levels on USD Majors, Commodities & Stocks
- Technical setups we are tracking into the weekly open / FOMC rate decision
- Next Weekly Strategy Webinar: Monday, September 23 at 8:30am EST
- Review the latest Video Updates or Stream Live on my YouTube playlist.
In this webinar we take an in-depth look at the technical trade levels for the US Dollar (DXY), Euro (EUR/USD), EUR/CAD, British Pound (GBP/USD), Australian Dollar (AUD/USD), Canadian Dollar (USD/CAD), Japanese Yen (USD/JPY), Swiss Franc (USD/CHF), Gold (XAU/USD), Crude Oil (WTI), Silver, (XAG/USD), S&P 500 (SPX500), Nasdaq (NDX) and the Dow Jones (DJI). These are the levels that matter on the technical charts heading into this week’s highly anticipated Fed interest rate decision.
US Dollar Index Price Chart – USD Daily

Chart Prepared by Michael Boutros, Sr. Technical Strategist; DXY on TradingView
The US Dollar index is trading just above key support into the weekly open at 100.61/82- a region defined by the February 2023 lows and the December low. Note that the lower parallel of the pitchfork and the objective September opening-range also converge on this threshold and further highlights its technical significance- looking for a reaction off this mark into FOMC with the immediate focus on a breakout of the monthly range.
A break / close below this pivot zone threatens another accelerated bout of losses toward the next major technical consideration at the 2019 high / 2023 low-day close (LDC) at 99.66/95 and the 61.8% retracement of the 2021 advance at 98.97.
Monthly-open resistance stands at 101.73 backed by the January LDC at 102.20- rallies should be limited to this threshold IF price is heading for a break lower. Broader bearish invalidation now lowered to 102.80/95. Keep in mind that we get the release of the updated interest rate dot-plot and economic projections from the Fed on Wednesday- expect increased volatility here. Stay nimble into the releases and watch the weekly close for guidance.
Gold Price Chart – XAU/USD Daily

Chart Prepared by Michael Boutros, Sr. Technical Strategist; XAU/USD on TradingView
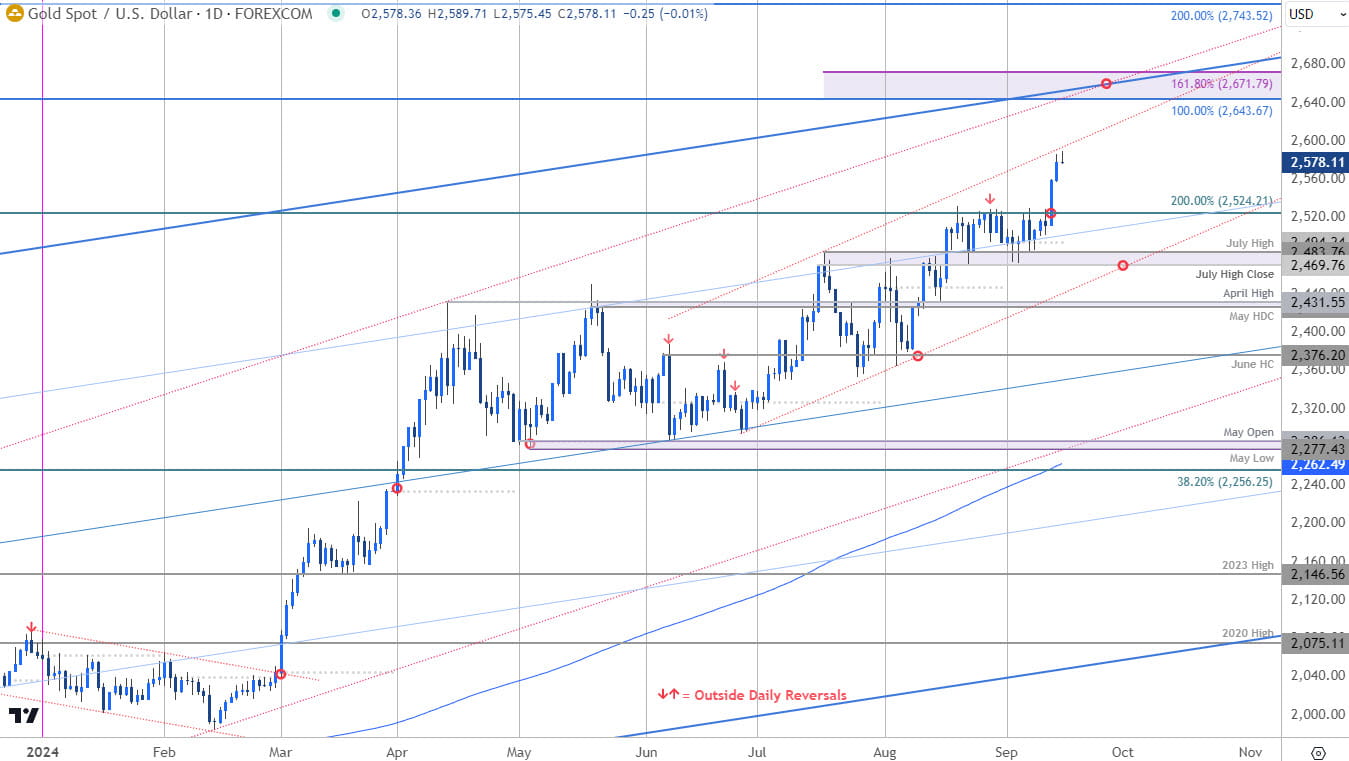
A breakout of the September opening-range takes gold to fresh record highs ahead of the Fed. The rally is trading just below parallel resistance into the start of the week with daily momentum trading just below 70- keep an eye on this.
Initial support now rests at 2524 backed by 2469/863- losses should be limited to this pivot zone IF price is heading higher on this stretch. Ultimately, a break below the June trendline would be needed to suggest a more significant high is in place. A breach / close above the July parallel exposes the next major resistance consideration at 2643/71- look for a larger reaction there IF reached.
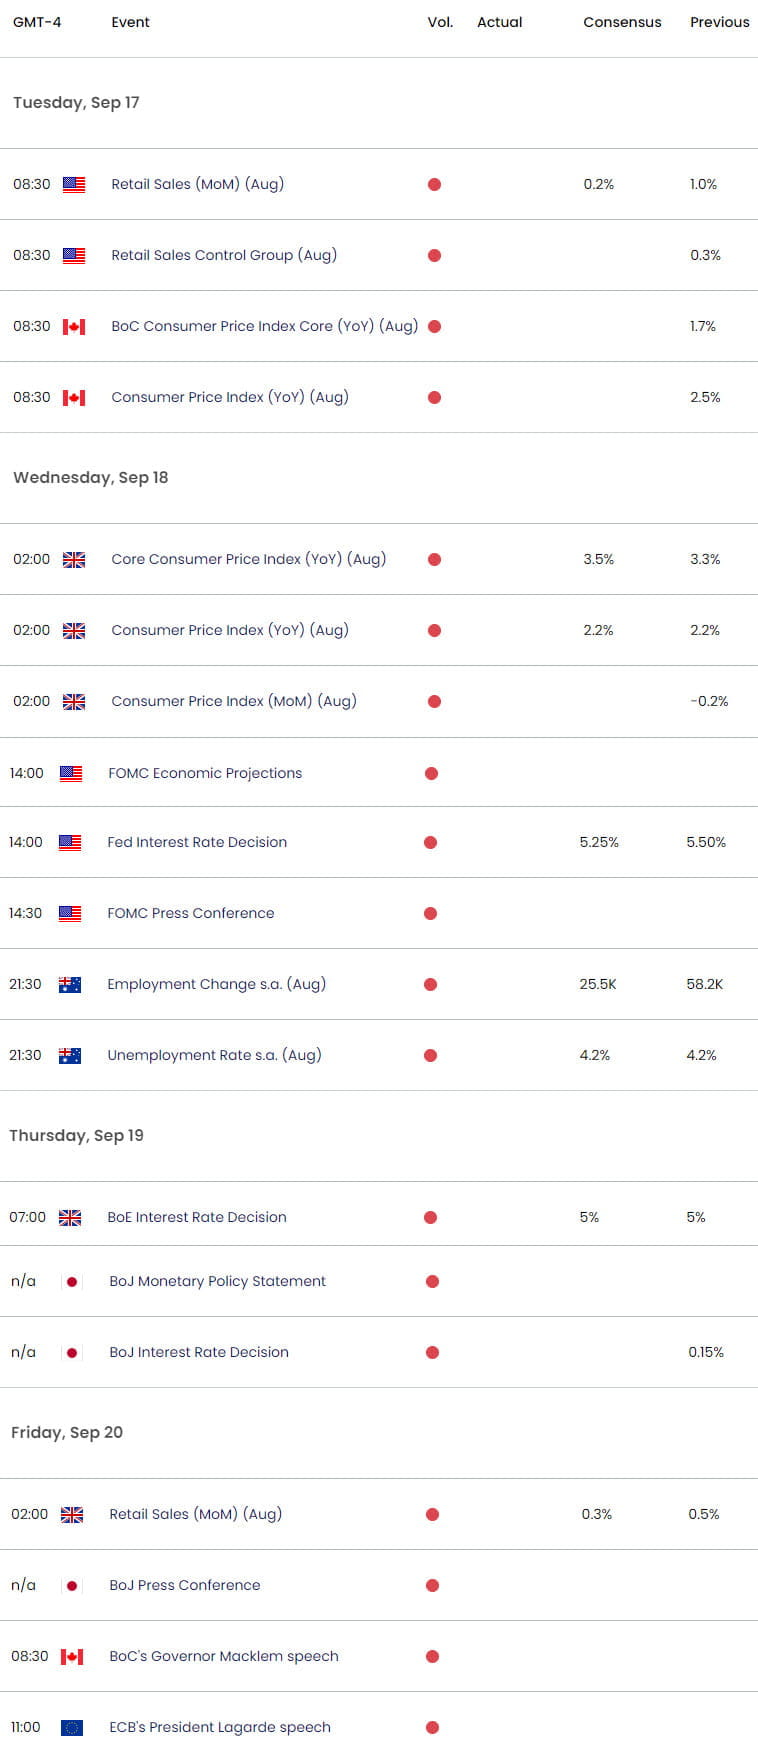
Economic Calendar – Key USD Data Releases

Economic Calendar - latest economic developments and upcoming event risk.
--- Written by Michael Boutros, Sr Technical Strategist with FOREX.com
Follow Michael on X @MBForex


