Weekly Technical Trade Levels on USD Majors, Commodities & Stocks
- Technical setups we’re tracking into the weekly open
- Next Weekly Strategy Webinar: Monday, November 6 at 8:30am EST
- Review the latest Weekly Strategy Webinars on my YouTube playlist.
In this webinar we take an in-depth look at the technical trade levels for the US Dollar (DXY), Euro (EUR/USD), British Pound (GBP/USD), Canadian Dollar (USD/CAD), Japanese Yen (USD/JPY), Australian Dollar (AUD/USD), Swiss Franc (USD/CHF), AUD/CAD, Gold (XAU/USD), Silver (XAG/USD), Crude Oil (WTI), S&P 500 (SPX500), Nasdaq (NDX) and Dow Jones (DJI). These are the levels that matter on the technical charts heading into weekly open.
British Pound Price Chart – GBP/USD Daily

Chart Prepared by Michael Boutros, Sr. Technical Strategist; GBP/USD on TradingView
The British Pound has been defending confluent support all month long at 1.2084/89- a region defined by the objective yearly open and the 78.6% retracement of the yearly range. Price has been contracting just above this threshold with monthly-open resistance now eyed at 1.2199. The focus is on a breakout of this near-term range for guidance into the close of the month. Keep in mind the BoE & Fed interest rate decisions are on tap with US Non-Farm Payrolls slated for Friday- watch the weekly close here.
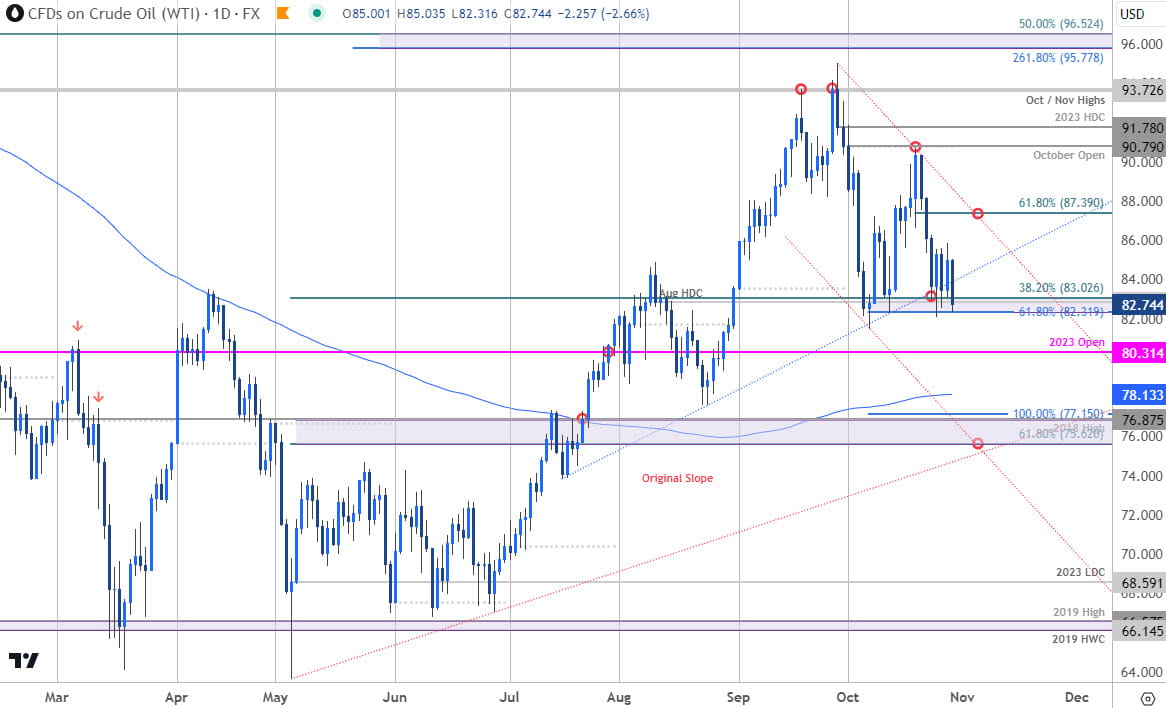
Oil Price Chart – Crude Daily (WTI)

Chart Prepared by Michael Boutros, Technical Strategist; WTI on TradingView
Oil prices have also been testing key support for the past four-weeks at 82.31-83.02- a region defined by the 61.8% Fibonacci extension of the September decline, the August high-day close, and the 38.2% retracement of the yearly range. A break / close below this threshold would threaten a deeper correction towards the yearly open at 80.31 and the 200-day moving average (currently ~78.13). Key support / broader bullish invalidation rests at 75.62-77.15.
Near-term bearish invalidation now lowered to the 61.8% retracement of the most recent decline at 87.39. Ultimately, a breach / weekly close above the yearly high-day close at 91.78 is needed to mark resumption of the broader uptrend.
S&P 500 Price Chart – SPX500 Daily

Chart Prepared by Michael Boutros, Sr. Technical Strategist; SPX500 on TradingView
The S&P 500 rebounded off confluent Fibonacci support on Friday at 4115- the immediate focus is on possible inflection off this zone into the close of the month with the bears vulnerable while above. Initial resistance eye at 4200 backed by the 200-day moving average (currently ~4253). Broader bearish invalidation now lowered to the 4304/08.
A break lower from here exposes the next lateral support confluence at 4051/60- a region defined by the 50% retracement of the 2022 rally and the May low-day close. Look for a larger reaction there IF reached.
Economic Calendar – Key USD Data Releases

Economic Calendar - latest economic developments and upcoming event risk.
--- Written by Michael Boutros, Sr Technical Strategist with FOREX.com
Follow Michael on Twitter @MBForex


