Euro Outlook: EUR/USD
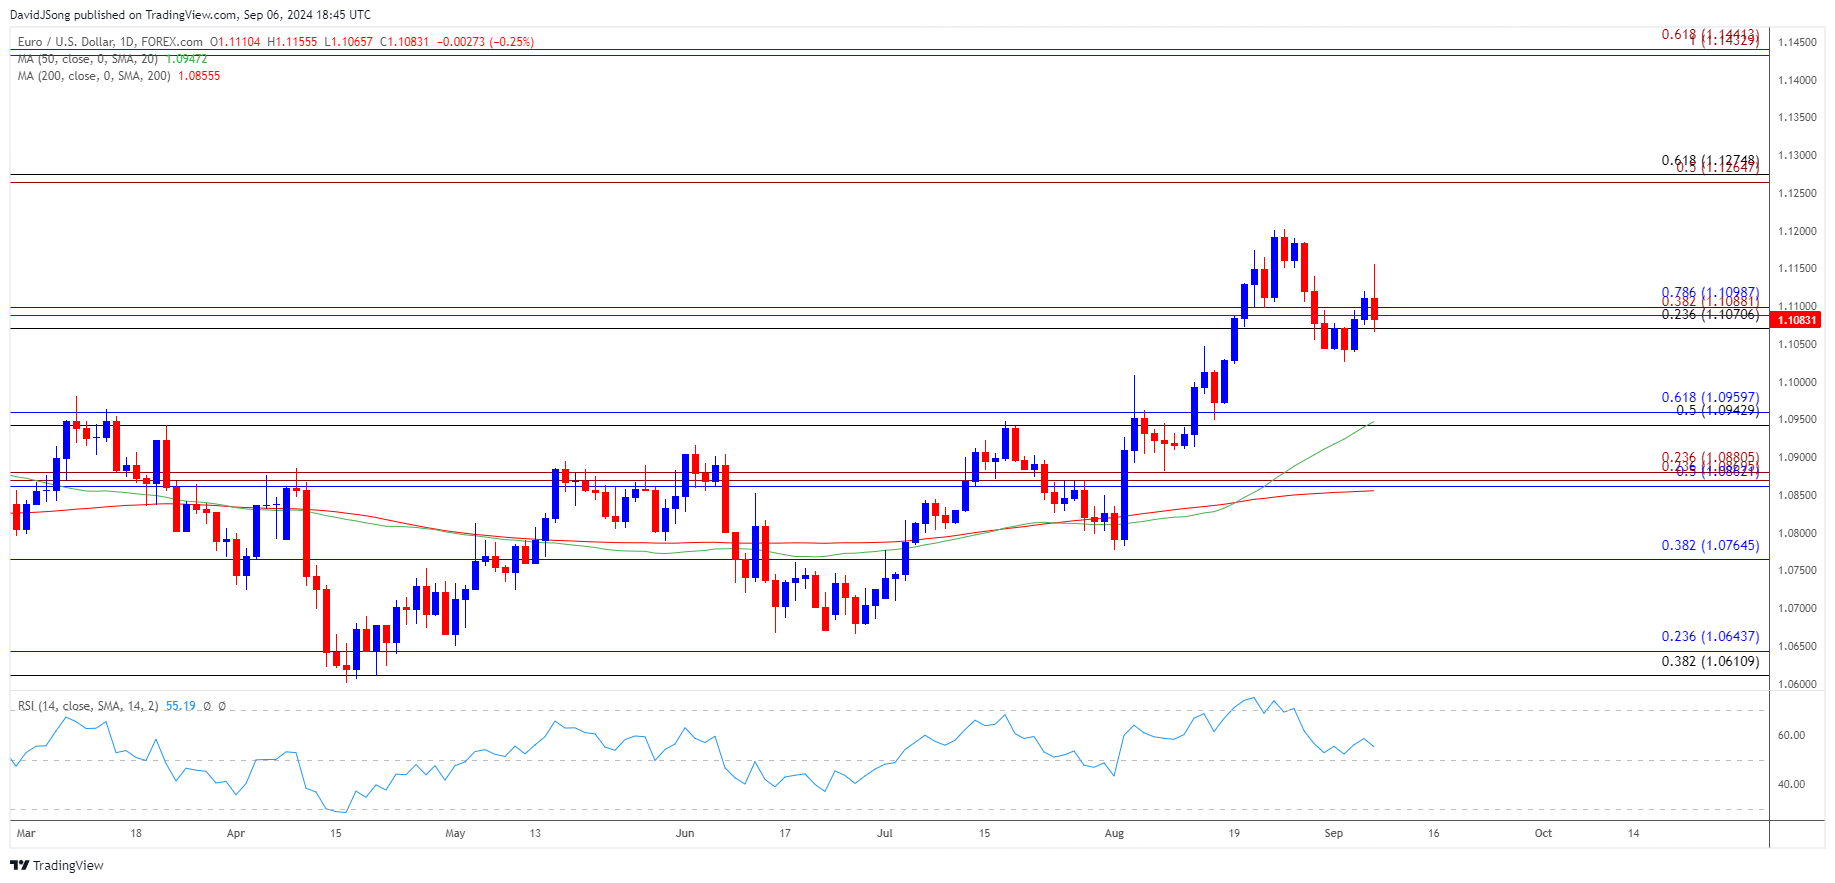
EUR/USD pulls back from a fresh weekly high (1.1156) amid the kneejerk reaction to the weaker-than-expected US Non-Farm Payrolls (NFP) report, but the exchange rate may track the positive slope in the 50-Day SMA (1.0947) as it holds above the moving average.
EUR/USD Pulls Back Ahead of August High with US CPI in Focus
EUR/USD appears to be reversing ahead of the August high (1.1202) as it snaps the recent series of higher highs and lows, and the exchange rate may face a larger pullback should it fail to defend the weekly low (1.1026).
Join David Song for the Weekly Fundamental Market Outlook webinar. David provides a market overview and takes questions in real-time. Register Here
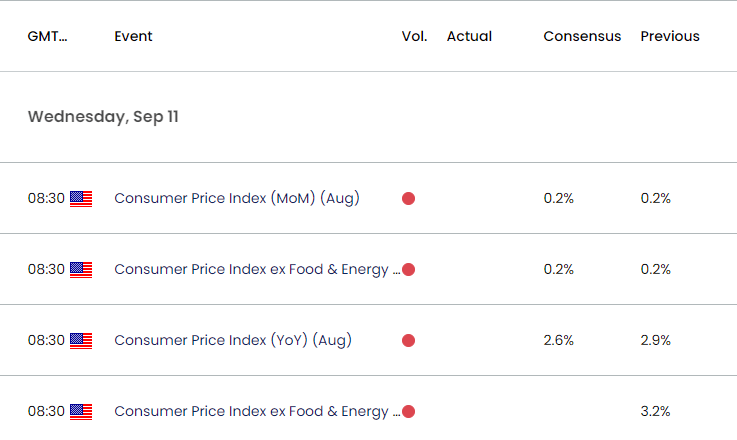
US Economic Calendar

Nevertheless, data prints coming out of the US may continue to sway EUR/USD as Chairman Jerome Powell states that the ‘timing and pace of rate cuts will depend on incoming data,’ and the Consumer Price Index (CPI) may encourage the Federal Open Market Committee (FOMC) to carry out a rate-cutting cycle should the update reflect slowing inflation.
With that said, a downtick in the CPI may drag on the US Dollar as it raises the Fed’s scope to quickly unwind its restrictive policy, but signs of persistent price growth may drag on EUR/USD as it puts pressure on the FOMC to further combat inflation.
EUR/USD Chart – Daily

Chart Prepared by David Song, Strategist; EUR/USD on TradingView
- EUR/USD may struggle to hold within the opening range for September as it snaps the recent series of higher highs and lows, with a breach below the weekly low (1.1026) bringing the 1.0940 (50% Fibonacci retracement) to 1.0960 (61.8% Fibonacci retracement) zone back on the radar.
- Next area of interest comes in around 1.0860 (50% Fibonacci retracement) to 1.0880 (23.6% Fibonacci extension) but EUR/USD may track the positive slope in the 50-Day SMA (1.0947) as it holds above the moving average.
- Lack of momentum to close below the 1.1070 (23.6% Fibonacci retracement) to 1.1100 (78.6% Fibonacci retracement) region may lead to further attempts to test the August high (1.1202), with the next hurdle coming in around 1.1270 (50% Fibonacci extension) to 1.1280 (61.8% Fibonacci retracement), which incorporates the 2023 high (1.1276).
Additional Market Outlooks
GBP/USD Rebound Pushes RSI Back Towards Overbought Zone
Euro Forecast: EUR/USD Opening Range for September in Focus
US Dollar Forecast: USD/JPY Rally Persists After Defending Weekly Low
Canadian Dollar Forecast: USD/CAD Rebound Emerges Ahead of March Low
--- Written by David Song, Strategist
Follow on Twitter at @DavidJSong


