US Dollar, Gold, EUR/USD Talking Points:
- Tomorrow brings the release of CPI data out of the US for the month of October.
- Both Gold and EUR/USD have shown support responses to open the week as we move towards that CPI release, begging the question as to whether a deeper pullback is on the horizon for the USD.
- I’ll be discussing these themes in-depth in the weekly webinar on Tuesday at 1PM ET. It’s free for all to register: Click here to register.
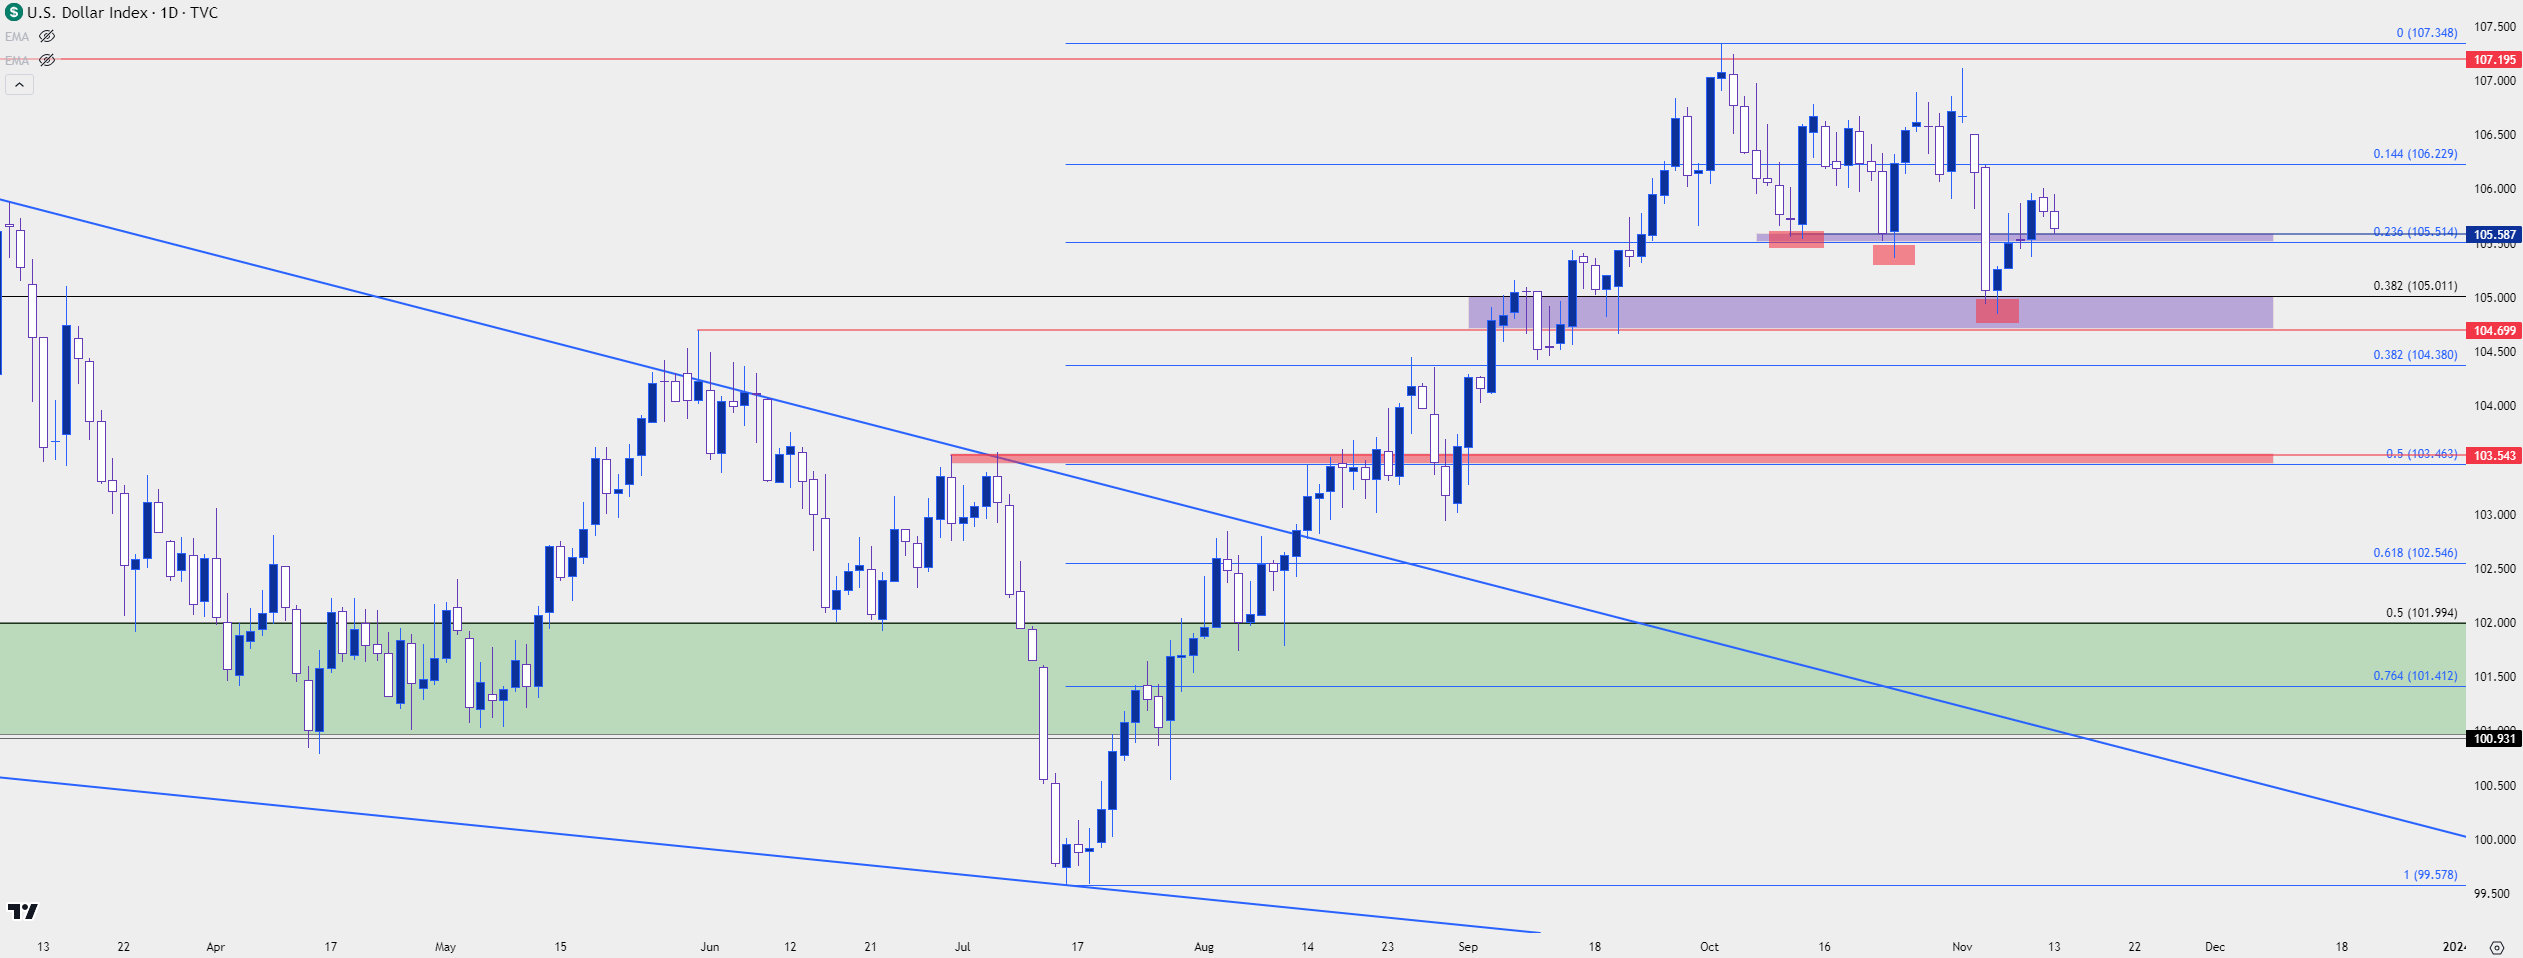
The US Dollar has thus far refused to yield to a deeper pullback. Tomorrow brings the release of October CPI, so perhaps something can change there but, from where we’re at now, bears have been stymied for more than a month.
Bears were in full control of the currency as we came into the month of July. A drastic breakdown move showed in July, helped along by the NFP data that was released on July the 7th. That led to a push below the 100 level on DXY in the week that followed, and sellers had an open door to run the trend and drive the USD to fresh lows.
But they failed – in a very big way. The initial pullback from that breakdown attempt saw little resistance, and that led into a massive 11-week pattern of strength that rivals any trend shown in the US Dollar over the past twenty years. As a matter of fact, there’s but one occurrence of a longer trend as taken from the weekly chart and that was back in 2014.
After that almost three-month explosion of strength, one might expect that a bit of a pullback from that theme would develop. For such a concerted one-side movement, there’s going to be an increasing slate of longs in a market so once a bit of turbulence showed, that usually leads into some form of pullback. If long, one would want to take profits, right? And this is what can feed into that ‘two steps forward, one step back’ type of action that populates during trends.
The main issue here is that we haven’t really seen the ‘one back’ part of that equation yet. Each time there was a bit of a step back, so far, bulls have jumped back on the move; only to stall again as we re-approach resistance around the 107.00 handle. This explains most of October, where bulls were showing strong responses to each lower-low that printed on the chart. Most recently, this happened at the 105.00 handle which came into play the week before last, after another NFP report.
US Dollar Daily Price Chart (indicative)

Chart prepared by James Stanley; data derived from Tradingview
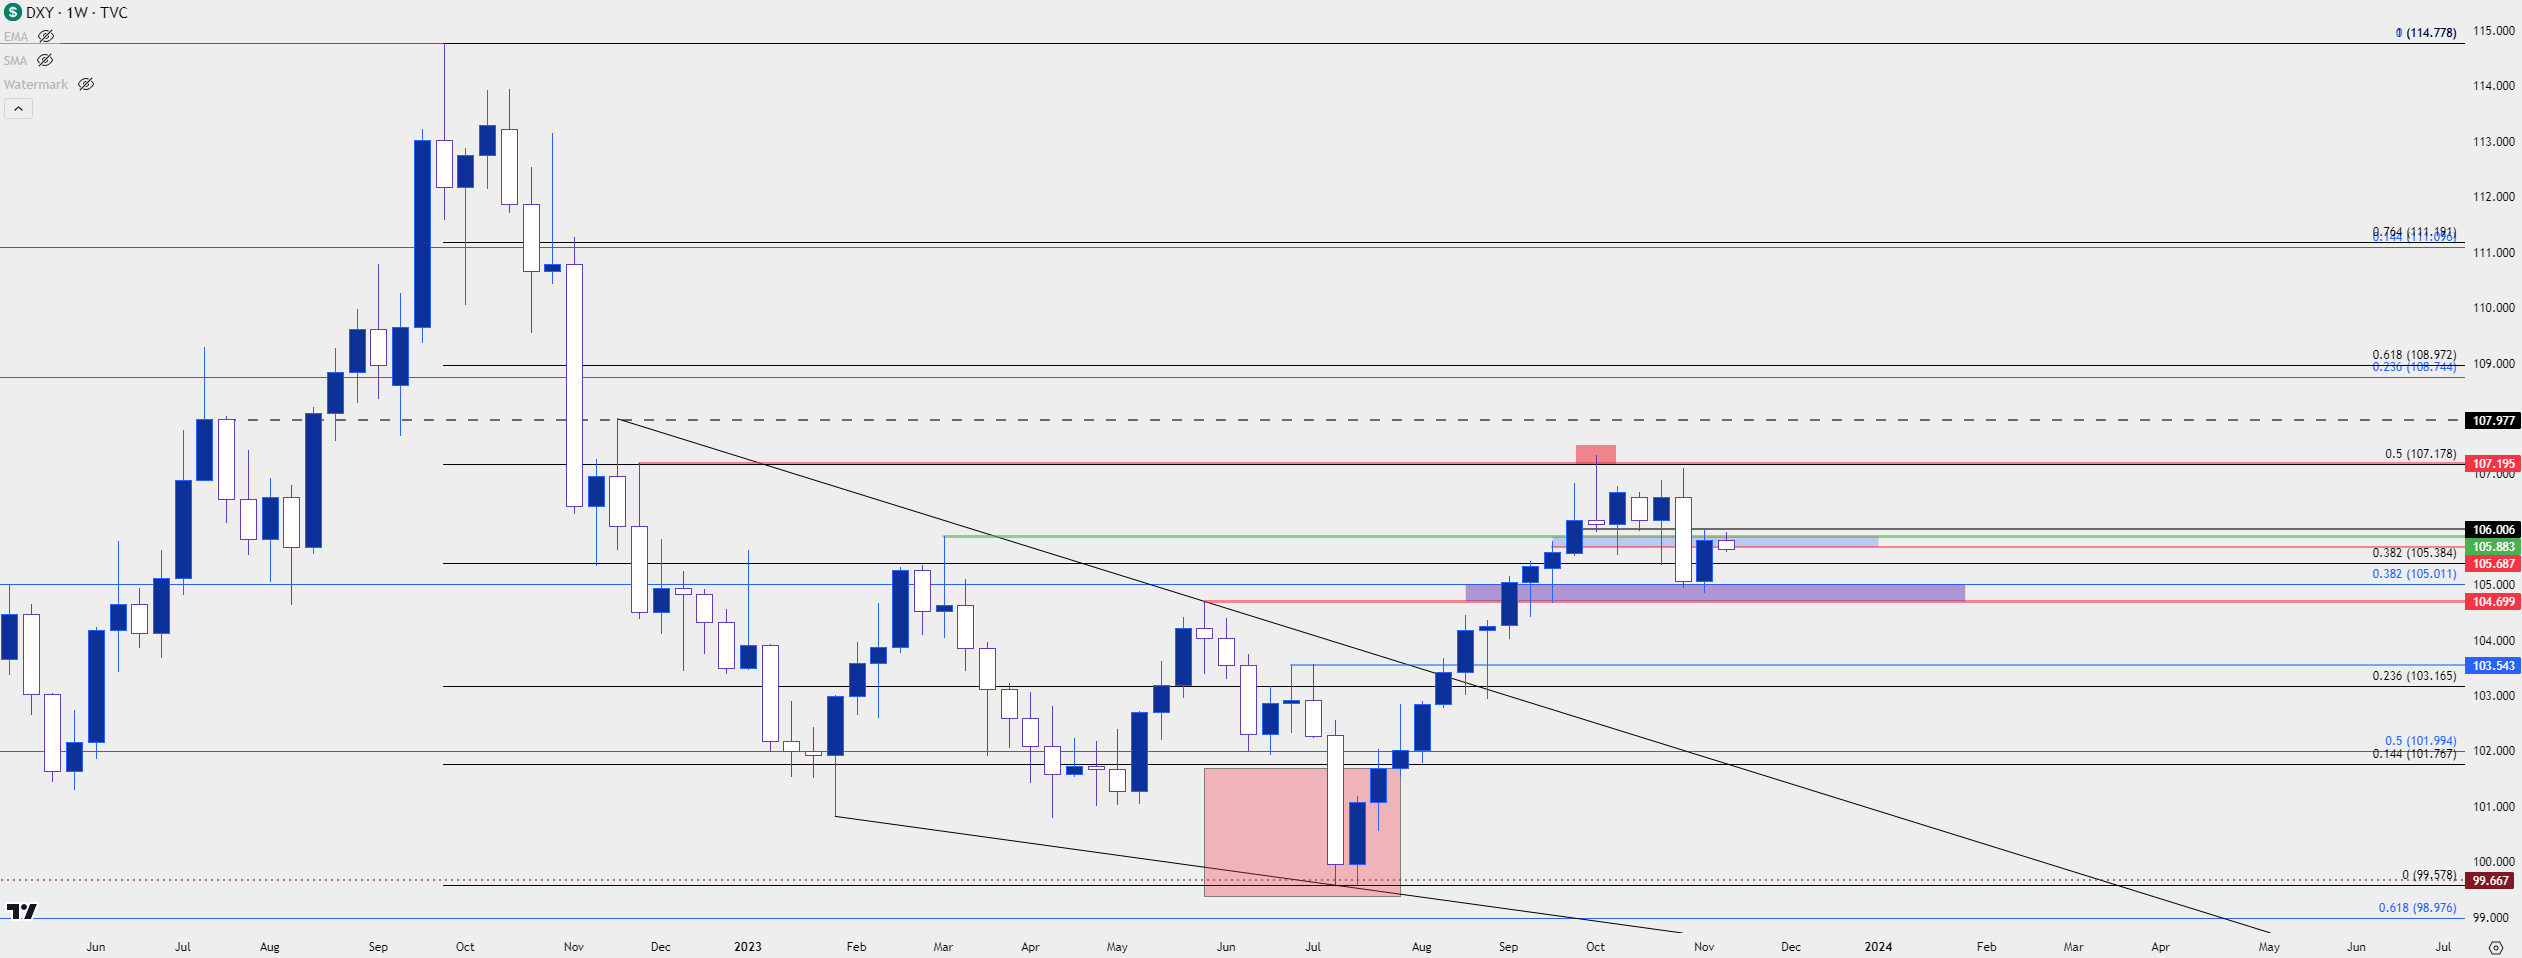
US Dollar Big Picture
At this point, the concern would be lower-high resistance. Last week saw a strong bounce develop from that 105.00 support test and that propelled price right into a resistance test at prior short-term support. This zone runs from 105.69 up to the prior 2023 high at 105.88. A hold here could mark a lower-high, which could keep the door open for a test of a lower-low.
The current support zone can be extended down to 104.70, which was the swing low from the September FOMC rate decision, as well as functioning as the late-May swing high.
US Dollar Weekly Price Chart (indicative)
 Chart prepared by James Stanley; data derived from Tradingview
US Dollar Shorter-Term
Going down to the four-hour chart highlights the recent bullish trend that held for much of last week, but this also puts some context behind the move as that rally developed from a fresh low.
The recent higher-low from last Thursday was at the Fibonacci level of 105.39 and if bulls can hold support above that, the door can remain open for short-term bullish trends.
At this point, the higher-high has held around a prior point of support around the 106.00 handle, which further illustrates why this current support is so important for bulls to hold above.
It was last November 10th when the US Dollar really came off, and the push point there was a CPI print that came in just below expectations. But, along with it came the hope that the Fed may be nearing a peak rate and that seems very similar to the current environment.
US Dollar Four-Hour Price Chart
 Chart prepared by James Stanley; data derived from Tradingview
EUR/USD: Bulls Begrudgingly Backing the Bid
EUR/USD was in a smooth bearish trend as that USD bullish trend had developed. But, it was late-September when matters began to shift and this is around when the pair started to re-test the psychological level at 1.0500.
I had warned of this as the pair was oversold when the test of the big figure started to show; and combined with an overbought US Dollar that made for a tough backdrop to anticipate continuation.
The 1.0500 level stalled EUR/USD for practically the entire month of October and as we near the half-way point of November, bulls have still failed to take-over.
But – they haven’t been invalidated yet. Price remains in a bullish channel and over the past week, EUR/USD has built a falling wedge formation which is often approached with aim of bullish breakout.
EUR/USD Daily Price Chart
 Chart prepared by James Stanley, EUR/USD on Tradingview
EUR/USD Big Picture
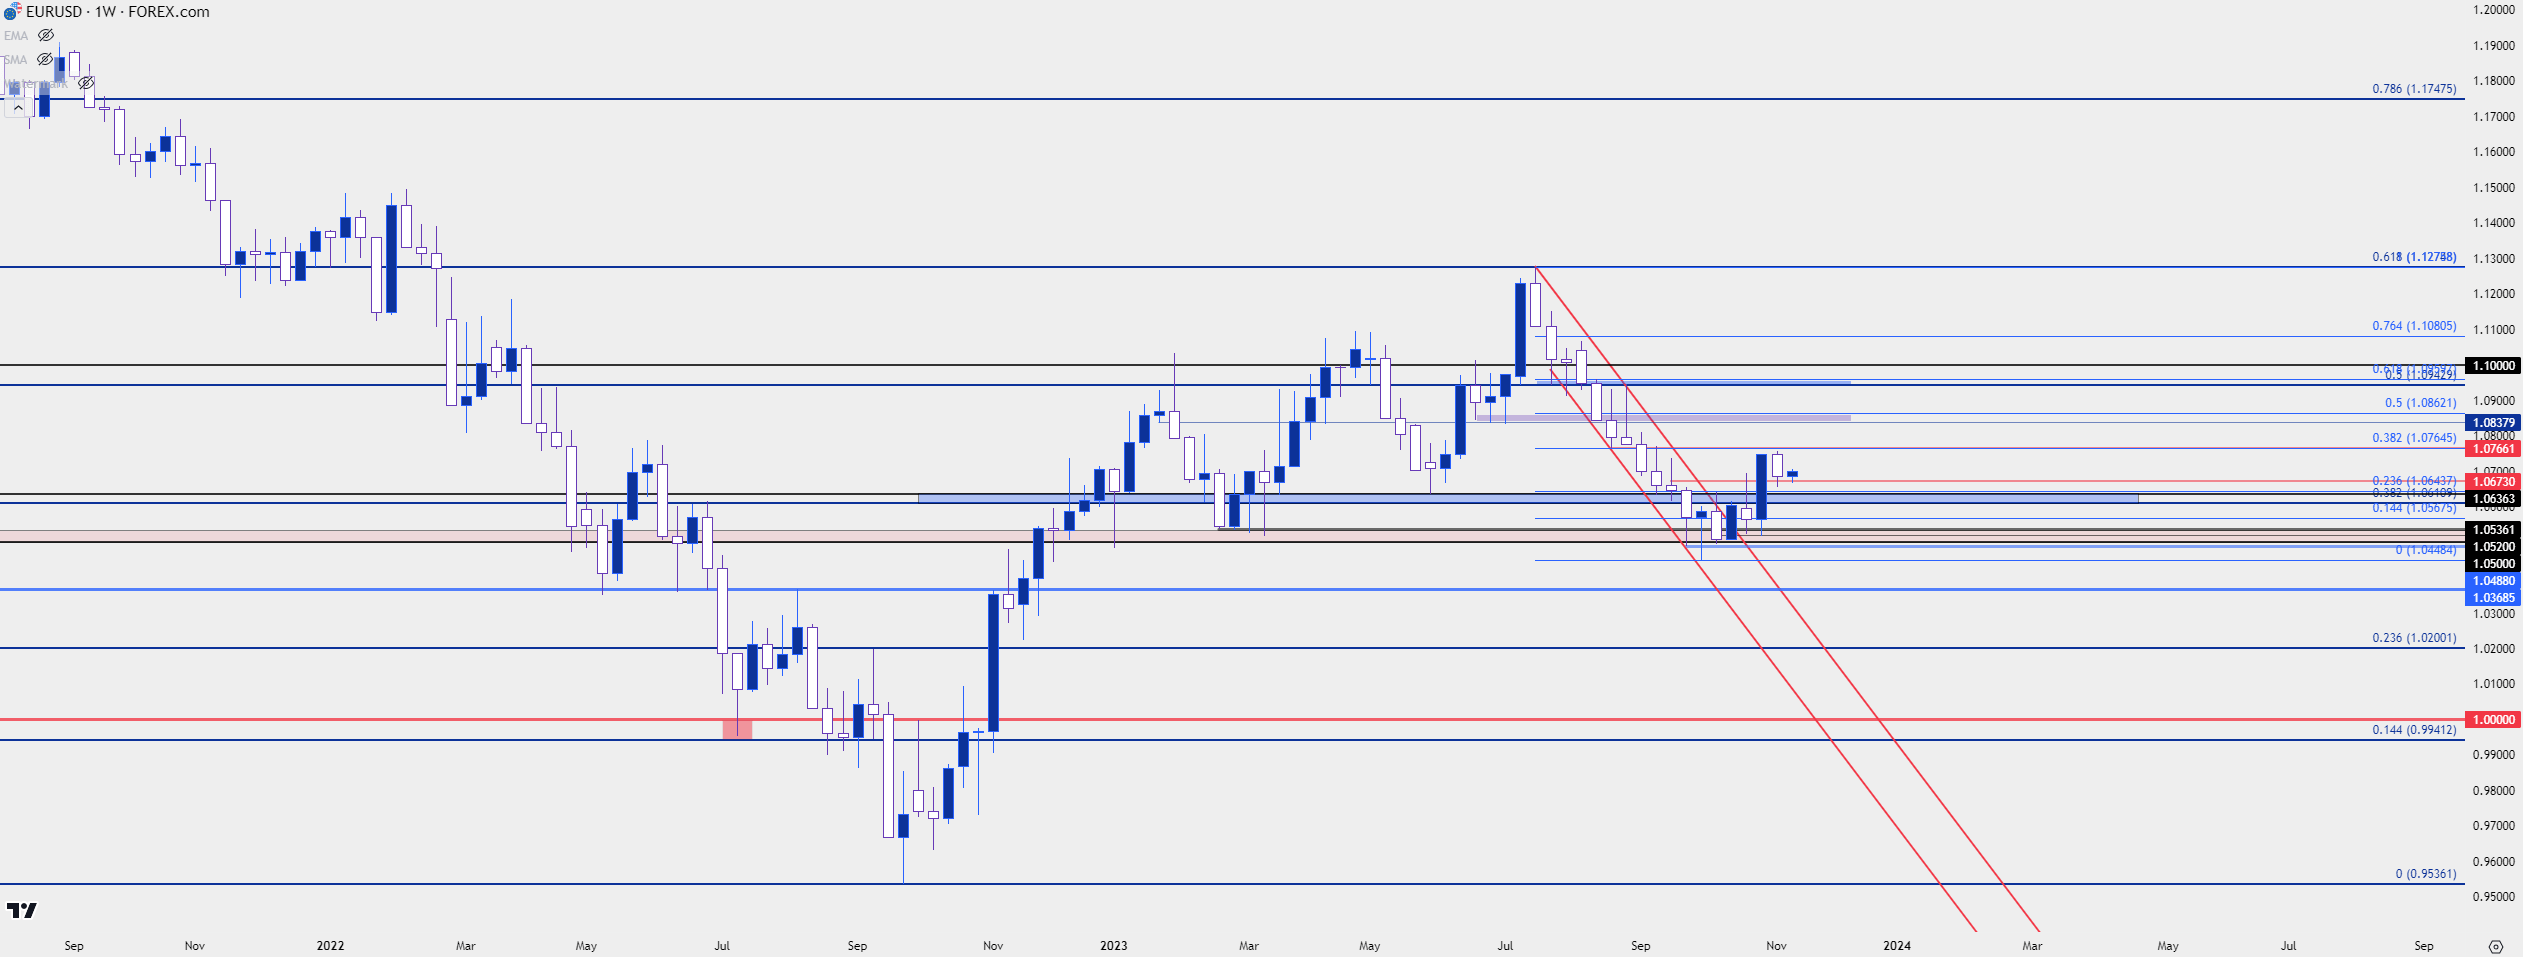
I think that the weekly chart can provide some color here, as that 11-week sell-off was incredibly persistent, and the pullback has so far been fairly jagged as there’s been mostly quick runs of strength that have slowly dissipated thereafter.
But really, this is somewhat similar to the USD above, right? This highlights a quick knee-jerk move to a fresh high followed by a slow grind as that move was clawed back. But, notably, from the weekly chart below we have a recent higher-high as resolution to that smooth-running trend, and this further reinforces the potential for higher-low support in the pair.
EUR/USD Weekly Price Chart
 Chart prepared by James Stanley, EUR/USD on Tradingview
Gold
I wanted to address gold here as the yellow metal has shown exceptional volatility of late. But I do want to caution around the possible correlation between gold and the US Dollar. It seems many assume an element of inverse correlation and while that can show at times, it’s inconsistent, and this can be a dauting factor for the trader to incorporate into their approach. So, I will address gold individually, but the below chart highlights this lack of consistency in any correlations between the US Dollar and gold, with the bottom portion of the below chart showing the correlation coefficient of XAU/USD and the US Dollar.
Notice that there can be times where the indicator holds very close to -1.0, which implies an inverse correlation. The problem is the lack of consistency and when that changes, traders using that in their analysis can find the dreaded situation of ‘right call, losing trade.’
Perhaps most importantly, of late that correlation has been moving towards the zero level, and the zero level implies no correlation between the monitored assets.
Gold (XAU/USD) and Correlation to USD – Weekly Chart
 Chart prepared by James Stanley, Gold on Tradingview
Gold prices were extremely weak coming into the month of October, and RSI had started to show some extreme-oversold readings.
But, it was around another NFP report when matters began to shift. I had published an article on the topic the day before NFP and I had highlighted RSI on the daily chart of gold going below the 20-level. This is rare, as it had only happened a few other times over the prior 20 years. And it led into one of the strongest bullish runs that’s been seen in some time as gold quickly pushed back up to the $2k level.
But, as we’ve seen on three other occasions over the past three years, prices began to congest at the big figure and as of this writing, it looks as though the fourth test over the big figure has been yet another failure.
Today’s daily bar sees price bouncing from a lower-low at a key level of 1932; with lower-high resistance potential showing just above current price.
Gold (XAU/USD) Daily Price Chart
 Chart prepared by James Stanley, Gold on Tradingview
Gold into CPI
Last year when the US Dollar cratered after CPI on November the 10th, EUR/USD and Gold both saw massive bullish breakouts.
This can keep gold on the move along with USD-pairs, even if the correlation remains as questionable. At this point gold prices have retraced 38.2% of the October breakout move, with support showing right around that variant of 1933, which is confluent with the 1932 level that I’ve been talking about.
Price is currently testing resistance at prior support, spanning from prior swing-highs at 1947 and 1953; but it’s what above that which remains important for bulls, as the 23.6% Fibonacci retracement of the October breakout rests at 1962.47; and if bulls can force a break above that, the door can quickly fly open for another test of the big figure at $2k as this would be a forceful change-of-pace to last week’s price action.
If bulls do fail to hold the lows, the next key zone of support spans from the $1900 psychological level up to the $1909 Fibonacci level, which is the half-way mark of last month’s breakout.
Gold (XAU/USD) Four-Hour Price Chart
 Chart prepared by James Stanley, Gold on Tradingview
--- written by James Stanley, Senior Strategist


