US Dollar, FOMC Talking Points:
- The Fed cut rates again at today’s meeting as widely expected.
- The Fed’s statement when announcing that rate cut removed an important line about the bank gaining confidence around inflation. This had an initial impact of stronger USD and weaker equities as it brought to question the expected rate cut for the December meeting.
- Throughout the press conference Powell refused to remark on future moves including the December meeting. That’s where the rubber will meet the road, however, as it’s a quarterly meeting and we’ll receive updated projections from the bank. As of right now markets are still pricing in another cut next month to a probability of 68.4%.
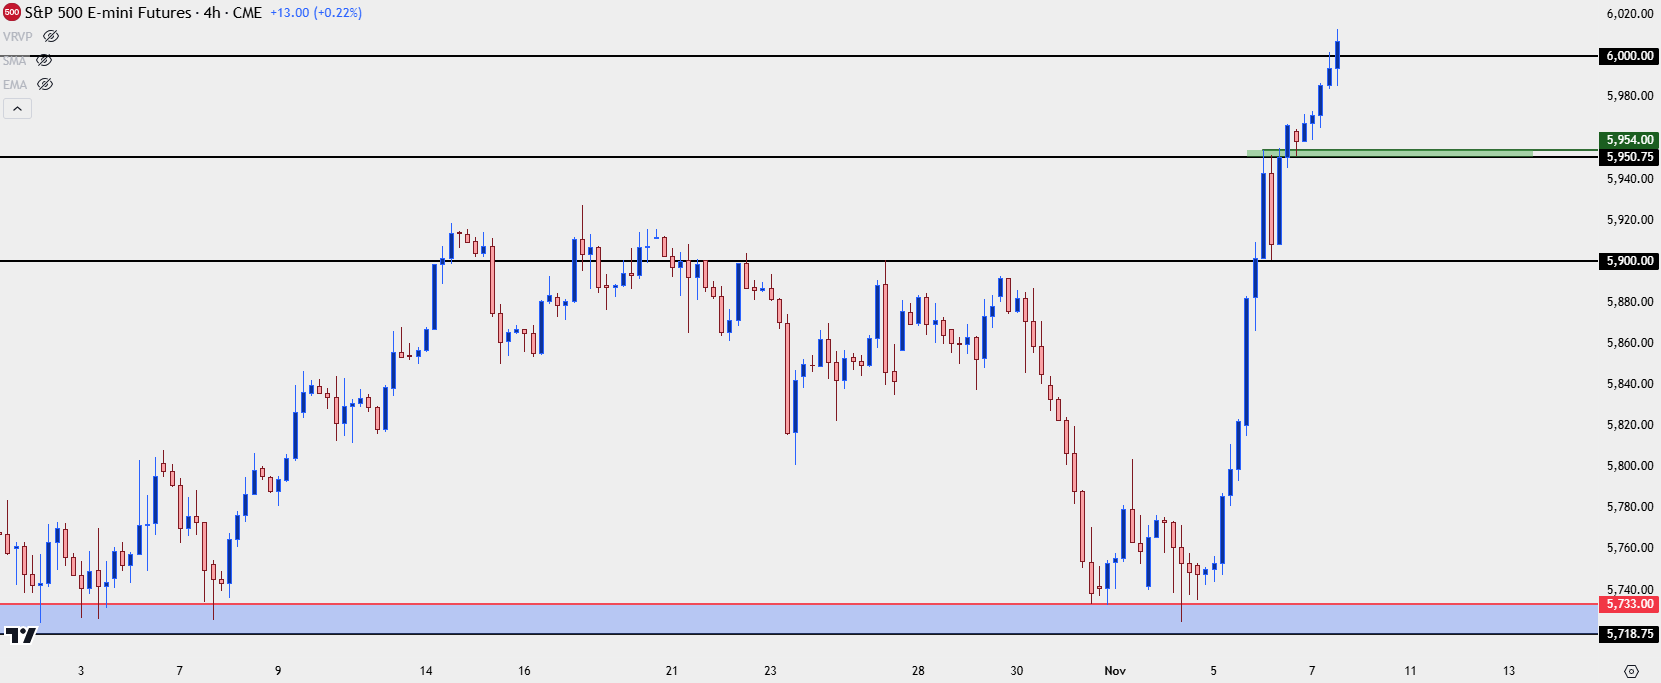
- The response in equities was more clear cut, with S&P 500 futures climbing above the 6k level for the first time ever. This aligns with my outlook in the Q4 forecast, which you can access from the link below.
It was a messy rate cut from the FOMC today. While Powell was clearly dovish in September when announcing the 50 bp rate cut, he was considerably less committal today around any future moves. The initial statement from the FOMC removed a key statement that, initially, was read as hawkish. The statement pertained to the Fed gaining confidence that they had control of inflation and when that was removed from today’s rate cut announcement, the initial reaction in the US Dollar was strength, and S&P 500 futures pulled back from the 6k level that it started to test earlier in the day.
But during the press conference Powell successfully assuaged fears and USD-weakness came back, and ES bounced back above 6k and continued its post-election incline.
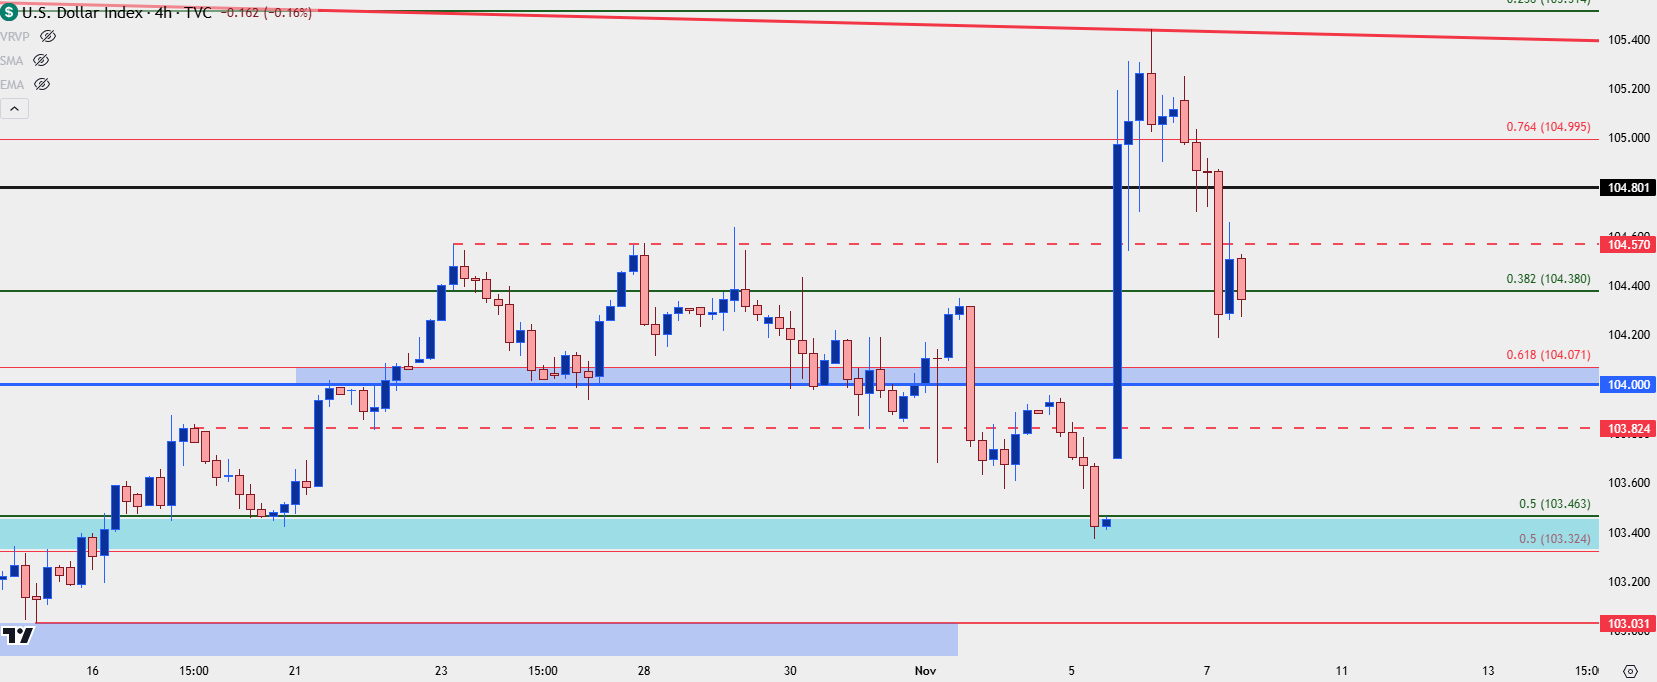
As usual, however, the immediate aftermath of a central bank press conference can be messy and disorderly. It’s only in the day(s) that follow that we’ll see how markets will digest the news. At this point the US Dollar has continued its pullback from trendline resistance, which followed the massive bullish move that priced-in after results of the election.
US Dollar Daily Chart
 Chart prepared by James Stanley; data derived from Tradingview
US Dollar Shorter-Term
I went over this in the video and article yesterday but as the post-election impact saw gains in both stocks and the US Dollar, it seemed unlikely that both asset classes would continue to rally together in the long-term.
It didn’t take long but the US Dollar has already erased a large portion of that rally but, again, we’re still in the early stages.
For today and around the FOMC meeting, resistance has held in DXY at the 104.57 level. I’m expecting a key support test around the 104-104.07 level after which the 200-day moving average comes into play. Below that it’s the same 103.32-103.46 zone that held the lows into the election before bulls launched a vigorous topside move.
US Dollar Four-Hour Price Chart
 Chart prepared by James Stanley; data derived from Tradingview
Stocks
As I also said in that video yesterday, along with my expectation for the US Dollar to remain in the longer-term range, it seems supportive for US equities. The post-election rally has continued to stretch and after S&P 500 futures had traded at support for four days around 5733, it’s now trading above 6k for the first time ever.
If we do see some profit taking, I’m expecting a key test at an area of support taken from prior resistance, around the 5950 area. If bulls fail to hold support there or above, then the door opens for deeper pullback potential.
S&P 500 Futures Four-Hour Chart
 Chart prepared by James Stanley; data derived from Tradingview
EUR/USD
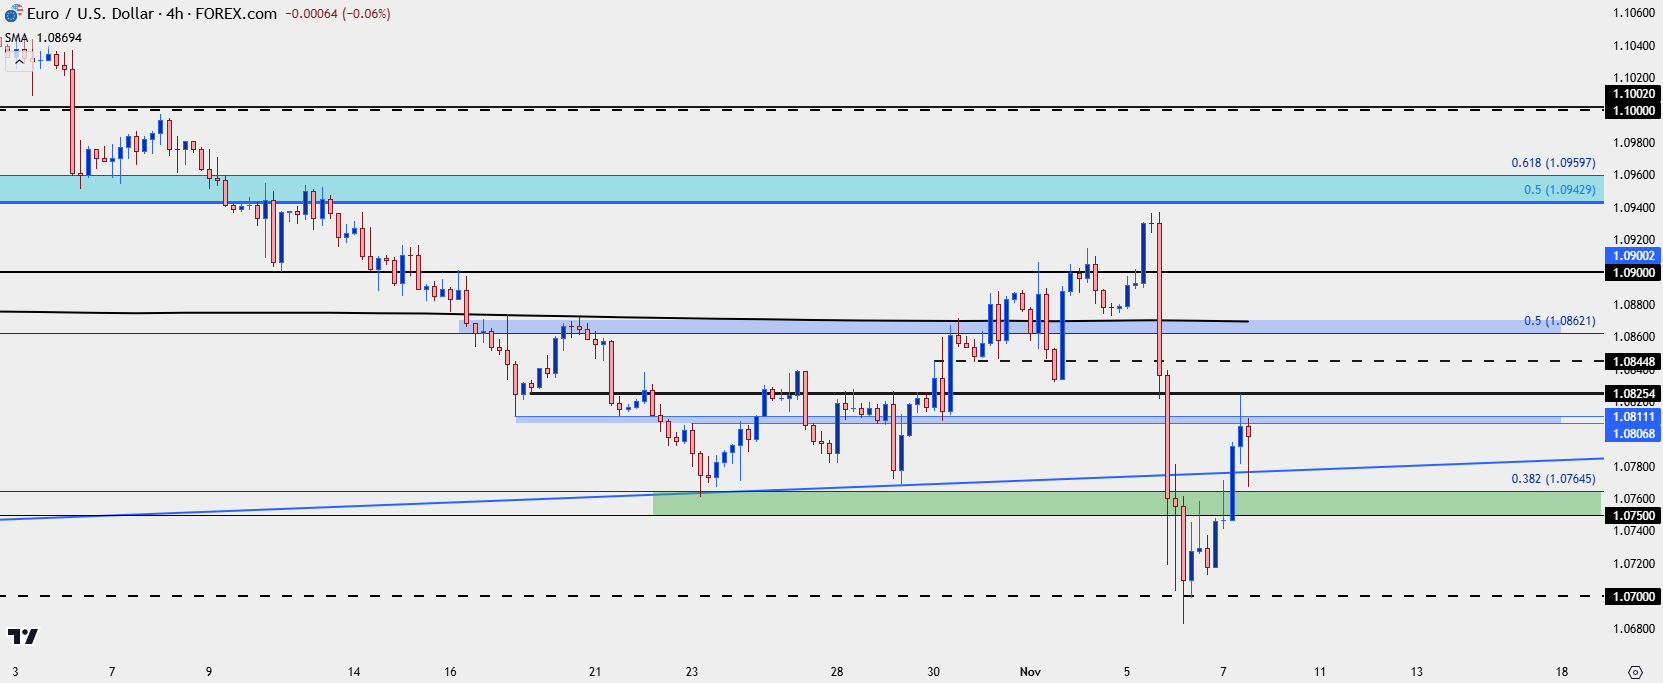
Going along with that expectation for USD to remain in its range, I similarly expect EUR/USD to remain within its two-year range. The pair put in a massive move in October and its largest single day sell-off since September 2022 after results of the election.
At this point, there’s higher-low support potential in the 1.0750-1.0765 zone and if bulls can hold support at or above that, the door is open for a trip up to 1.0845 and then the zone around the 200-day moving average, plotted from around the Fibonacci level at 1.0862-1.0872.
EUR/USD Four-Hour Price Chart
 Chart prepared by James Stanley, EUR/USD on Tradingview
USD/JPY
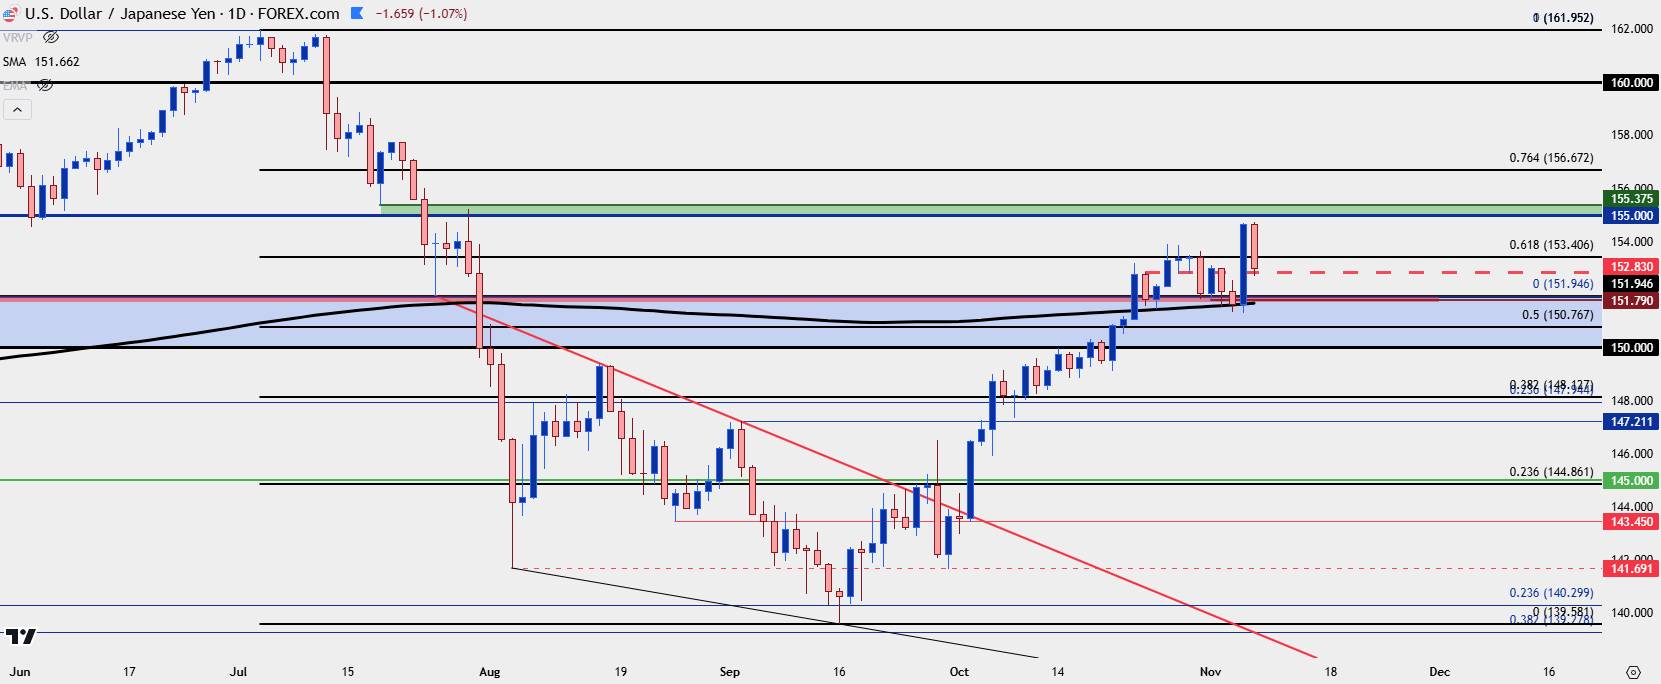
It was USD/JPY that drove the US Dollar in Q3 the first month of Q4, but this is a gigantic question mark now after the election and the Fed’s most recent rate cut. But rather than speculate around headlines I want to default to pure price action here, and at this point the daily chart remains in a bullish posture given the hold at the 200-day moving average leading into the election.
There’s also some support potential and this could set the stage for higher-lows, at the 151.95 level that had set the high in Q4 for each of the past two years.
There’s already a test taking place at a shorter-term level of note at 152.83. This was a prior swing high that set support for a couple days last week.
For next resistance, it’s the 155.00 level that sticks out above current price action, and that can be spanned up to the prior swing low of 155.38.
USD/JPY Daily Price Chart
 Chart prepared by James Stanley, USD/JPY on Tradingview
--- written by James Stanley, Senior Strategist


