Euro, EUR/USD Talking Points:
- It’s ECB week and the bank is widely-expected to cut rates at Thursday’s meeting.
- The bigger question is perhaps what the bank signals after a possible rate cut. If the ECB highlights the possibility of another near-term cut, Euro bears could get some extension. But if they remain evasive on the matter, the current trend of EUR/USD strength could persist into resistance levels of 1.0943 and 1.1000.
- I’ll be discussing these themes in-depth in the weekly webinar on Tuesday, previewing Bank of Canada, the ECB and NFP. It’s free for all to register: Click here to register.
We’re now in an important spot of the economic calendar as the next two weeks bring rate decisions out of both Europe and the United States. There’s an NFP report set to be released in-between and we just had the most recent installment of US Core PCE, which led to a volatile finish to last week.
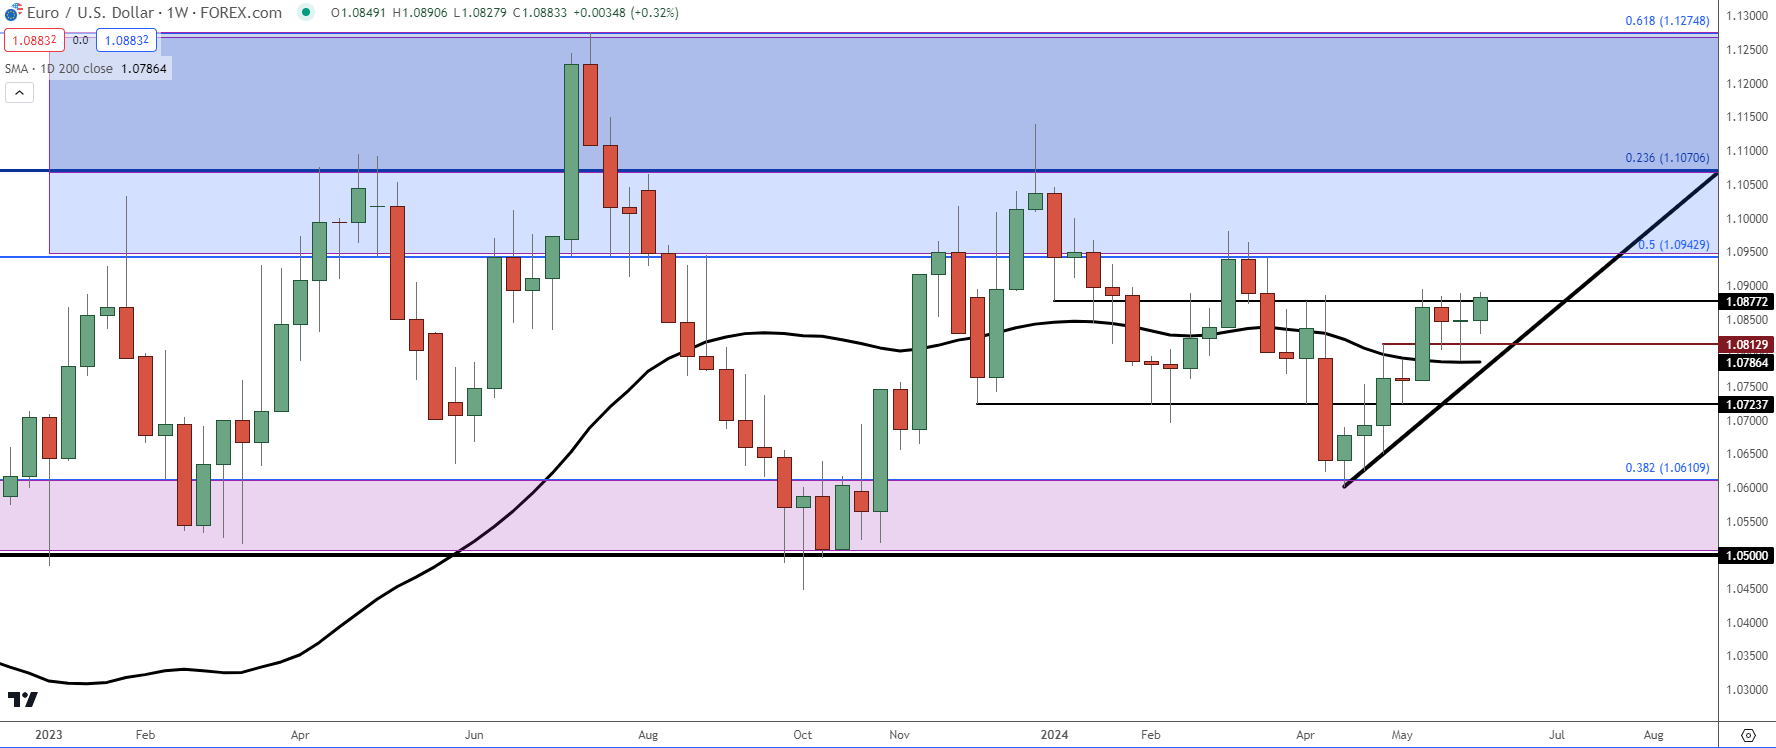
In EUR/USD, the bullish breakout that pushed in mid-May on the back of the US CPI report has since stalled and the past two and a half weeks have shown a volatile and choppy backdrop in the pair. Support showed up last week before a test of the 200-day moving average as sellers were thwarted around the 1.0800 level. Thursday and Friday saw buyers claw back prior losses and the net result for last week was a doji on the weekly chart of EUR/USD.
EUR/USD Weekly Price Chart
 Chart prepared by James Stanley, EUR/USD on Tradingview
EUR/USD Daily Chart
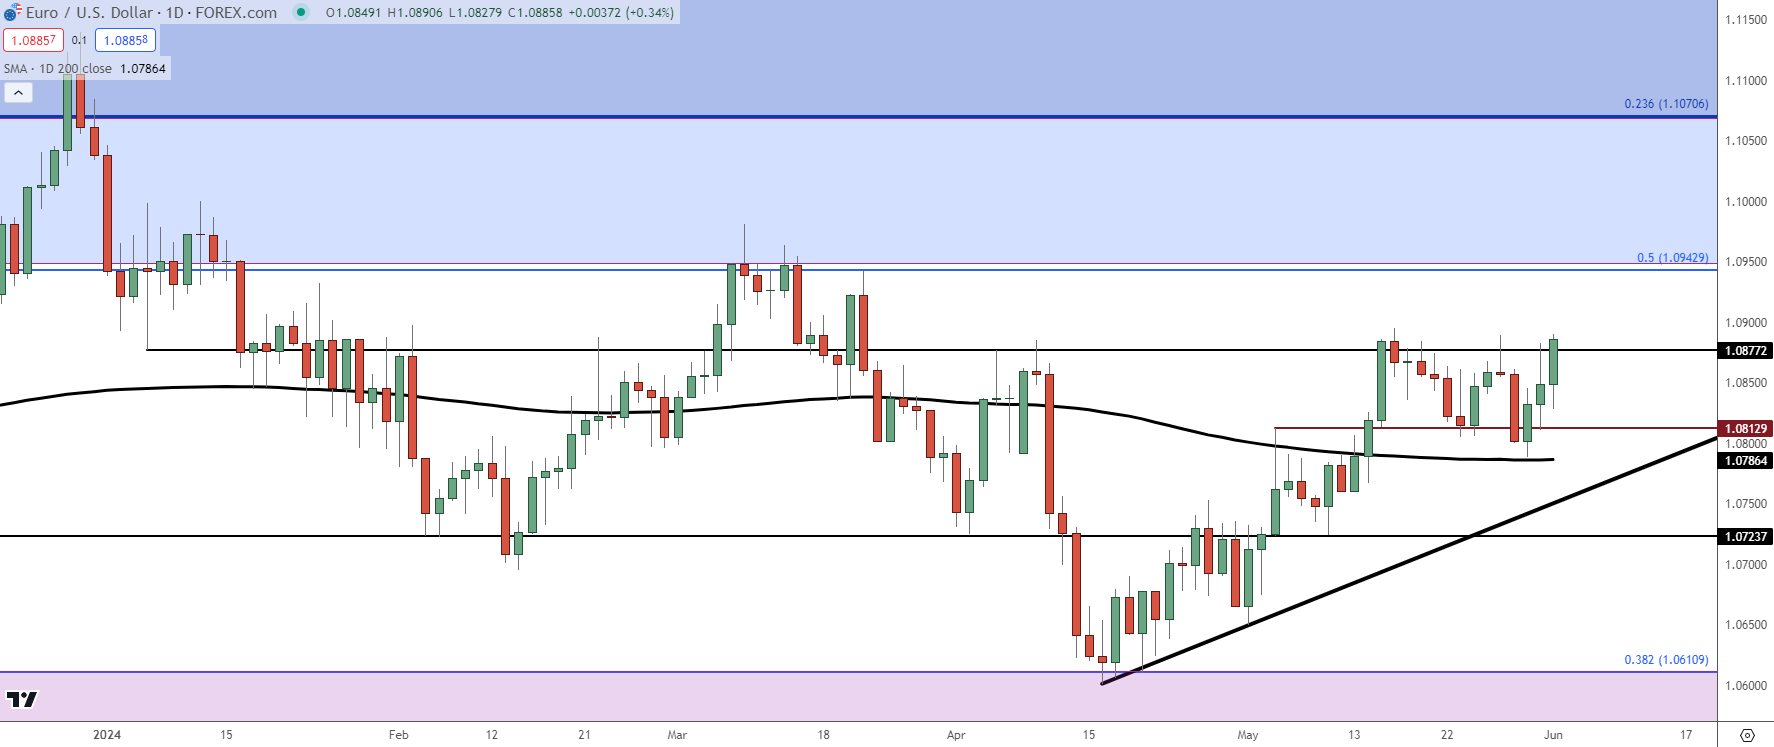
EUR/USD bulls have been in-control for more than six weeks now. Support showed up at 1.0611 in mid-April, a little less than a week after the US CPI report. And what started as a grinding pullback soon got new life, helped by the FOMC rate decision on May 1st and then pushed further with the NFP report a couple days later. That’s what produced the first re-test of the 200-day moving average, which then held as resistance for the next week until buyers began to push ahead of the May CPI report.
That CPI report came out more encouraging for FOMC doves as it showed the lowest read in Core CPI in three years. But – it was still at 3.6% which means that there’s still some way to go before the Fed’s 2% target is attained. Nonetheless, it was a step in the right direction for those looking for rate cuts out of the US Central Bank later this year.
The day after that CPI report, however, saw the trend stall with a pullback developing. At this point, we still haven’t seen the swing-high taken out from the CPI-fueled breakout.
From the daily chart below, we can see a continuation of higher-highs and lows, with last week showing bullish defense ahead of a re-test with the 200-day moving average. This keeps bulls in control of the trend and the next significant spot of resistance is the same 1.0943 level that was last in-play in March, helping to hold the highs before bears took back over.
EUR/USD Daily Price Chart

Chart prepared by James Stanley, EUR/USD on Tradingview
EUR/USD Continuation Potential
As EUR/USD has found itself stuck within a range for the past 17 months, so has the US Dollar. And as looked at on the weekly chart of EUR/USD above, the pair is nearing a re-test of longer-term range resistance.
But if we’re looking at the possibility of continuation, it’s also worth taking a look at the US Dollar and then coalescing with which scenarios may allow for such. And as EUR/USD grinds into a zone of resistance with another spot of resistance sitting overhead, there’s a similar but mirror image type of dynamic showing in the US Dollar.
The Greenback tested and bounced from the 200-day moving average twice last week while also holding a bullish trendline taken from the December and March swing lows. There’s a couple of additional supports below with 104.08 serving as the May swing low, and 103.92 the April swing low. That latter price is especially important for price action structure, as this was the last higher-low before the USD breakout ran up to 106.50 (eventually setting a double top, which has since filled in and completed).
The month of May showed a series of shorter-term lower-lows and highs developing, and that sets up for a key test between 103.92 and 104.08, as sellers posing a breakdown from that area would highlight a continuation of lower-lows and highs while also nullifying the prior bullish structure.
But – what would it take for this scenario to happen? Likely, we would either need the ECB to refrain from a rate cut or signal that no additional rate cuts are imminent after a 25bp reduction. But perhaps more importantly the NFP report that drops a day later would probably need to come out very soft, which could bring on USD-weakness ahead of next week’s FOMC rate decision. This would allow the Fed to get a bit more certain with forward-looking rate cut potential.
US Dollar Daily Price Chart
 Chart prepared by James Stanley; data derived from Tradingview
EUR/USD Shorter-Term: Levels
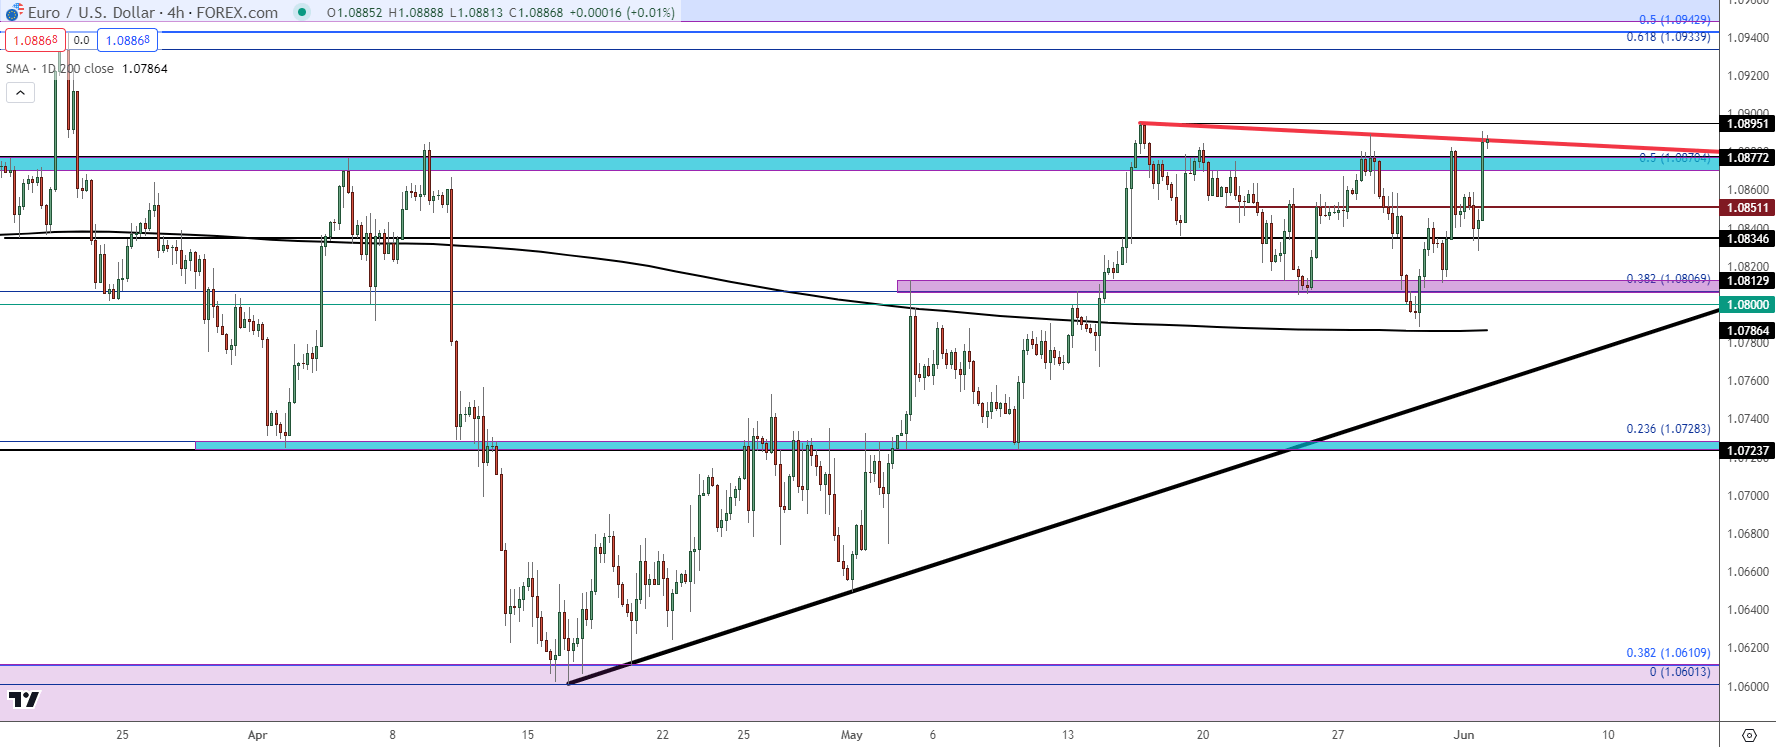
From the four-hour chart, we can see EUR/USD challenging a bearish trendline that connects the mid-May swing high with last week’s high. The two-month high is just above that at 1.0895 and then it’s the 1.0930-1.0943 zone that sticks out as this marks the beginning of longer-term range resistance.
If bulls can power through that, the 1.1000 level appears and this held two tests in the first two weeks of this year before sellers took over.
On the underside of price there’s a few spots of support potential that could still keep bulls in-control: A hold at 1.0870 would be an aggressive show from buyers and the 1.0851 level could also equate to a higher-low. Just below that, 1.0835 held a higher-low earlier this morning to lead to the current resistance test and if sellers can push below that, there’s a zone from 1.0807-1.0813 that remains of interest.
That support zone along with the 1.0800 level is likely what sellers would need to take out to exhibit greater control and a failure from bulls to run with the breakout setup that’s been brewing so far in early-trade to start the week.
EUR/USD Four-Hour Price Chart
 Chart prepared by James Stanley, EUR/USD on Tradingview
--- written by James Stanley, Senior Strategist


