Euro Talking Points:
- Next week is big for macro markets and we’ll get European GDP data on Tuesday before Euro inflation data on Wednesday ahead of the FOMC.
- The bigger item around the single currency this week was the bearish break of the falling wedge in EUR/JPY.
- I’ll be discussing these themes in-depth in the weekly webinar. It’s free for all to register: Click here to register.
EURUSD AD
It was a quiet week in EUR/USD, which makes it somewhat of an outlier for macro from the past week. The pair came into the week with continued descent following the resistance test at the 1.0943 level in the week prior. Sellers began to slow the push on Wednesday, leading to a pullback on Thursday and Friday and as of this writing the pair is holding resistance at the 1.0862 Fibonacci level, which is the 50% mark of last year’s major move.
Of note, the pair avoided a test of a key zone of confluent support: The 200-day moving average is confluent with the prior swing high of 1.0817, which constitutes the top side of a zone that was last in-play as support in early-July.
EUR/USD Daily Price Chart
 Chart prepared by James Stanley, EUR/USD on Tradingview
EUR/USD: Mean Reversion Still the Mode For Now
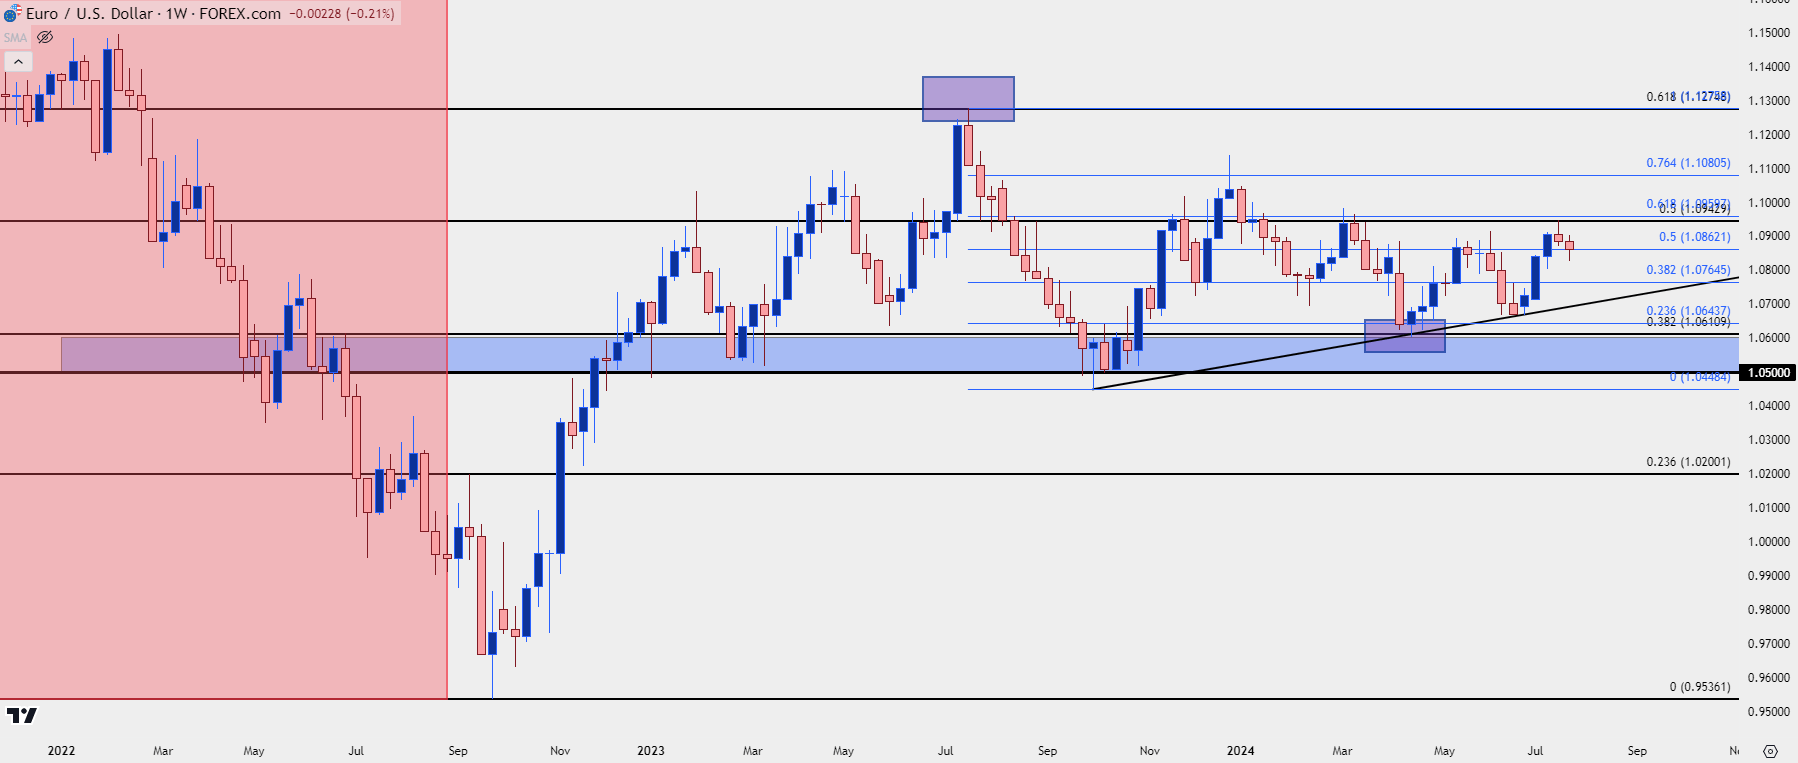
From the weekly chart we can see the continued range that’s held in the pair, along with the importance of the 1.0943 level. That’s the 50% mark of the 2021-2022 major move, which is related to the 61.8% retracement that caught the high last year, and the 38.2% Fibonacci retracement that has, so far, set the low for this year.
The 1.0943 level was a clean hold in the previous week and it had shown a similar resistance inflection back in March.
All eyes are on the FOMC for next week and the wide expectation is that the bank will begin to lay the groundwork for rate cuts set to begin in September. The bigger question, however is whether it would be enough to elicit a break of 1.0943 or whether the range sees prices continue to tilt-lower, with the 200-day moving average as the next key spot of support, followed by the 1.0766 level.
EUR/USD Weekly Price Chart
 Chart prepared by James Stanley, EUR/USD on Tradingview
EUR/JPY
If looking for volatility and large moves in the Euro, there may be more operable venues, such as EUR/JPY.
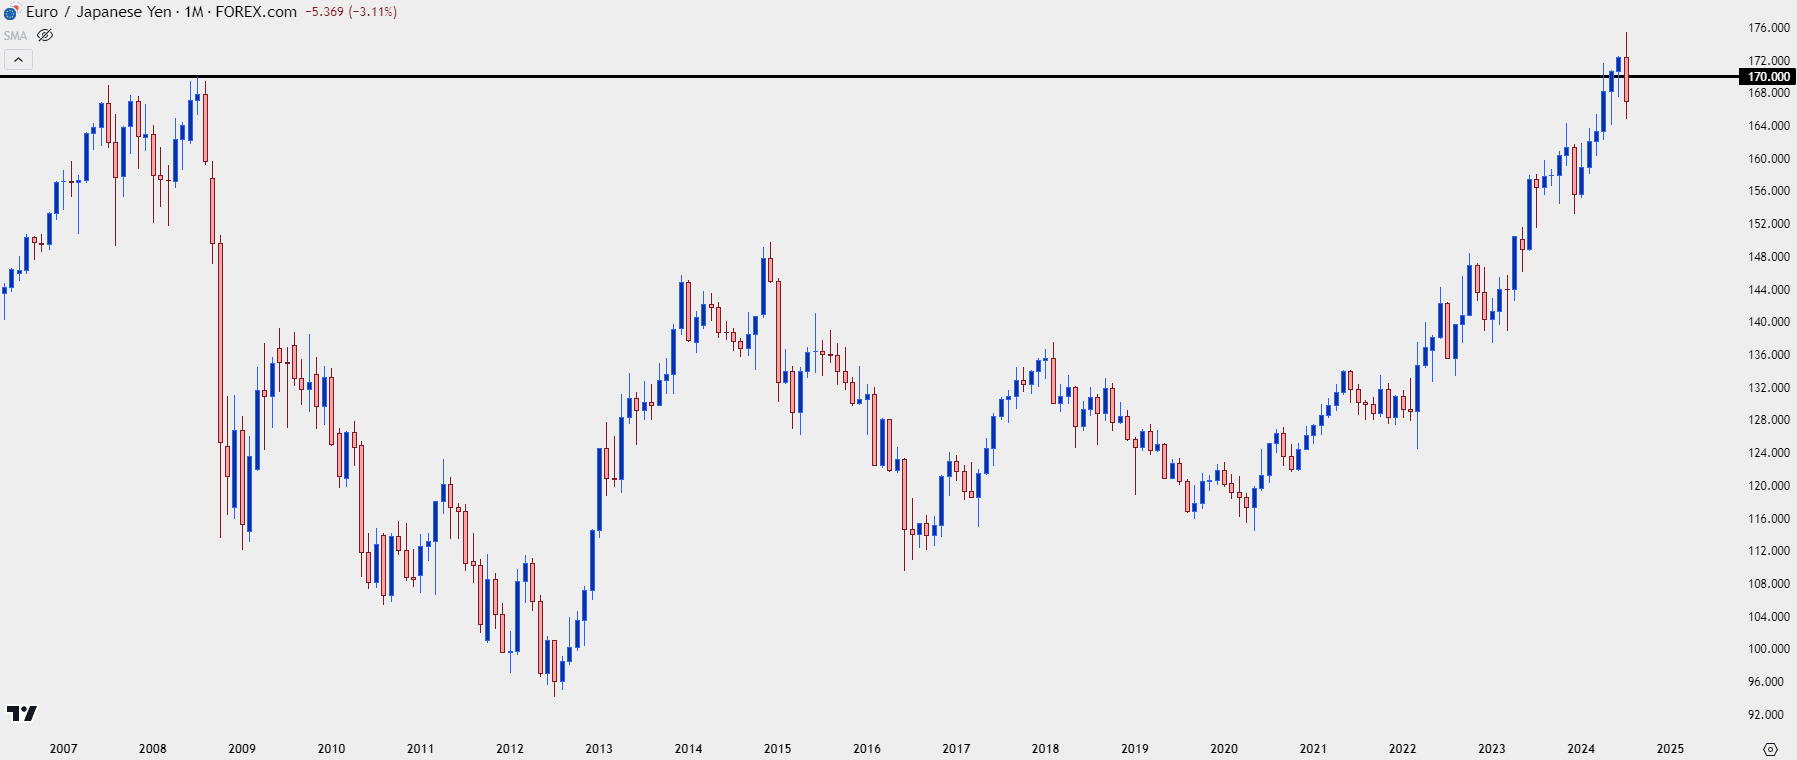
The pair rallied to fresh all-time-highs earlier in the month: The Euro came into inception in 1999 and, since then, had only briefly tested above the 170.00 psychological level.
This became an ordeal over the past few months, with 170.00 initially holding resistance in April, but in May and June bulls continued to push the grind until, eventually, there were short-term bullish trends holding above that level. There was even an item of support in the prior week but last week, sellers finally went for the breakdown.
EUR/JPY Monthly Price Chart
 Chart prepared by James Stanley, EUR/JPY on Tradingview
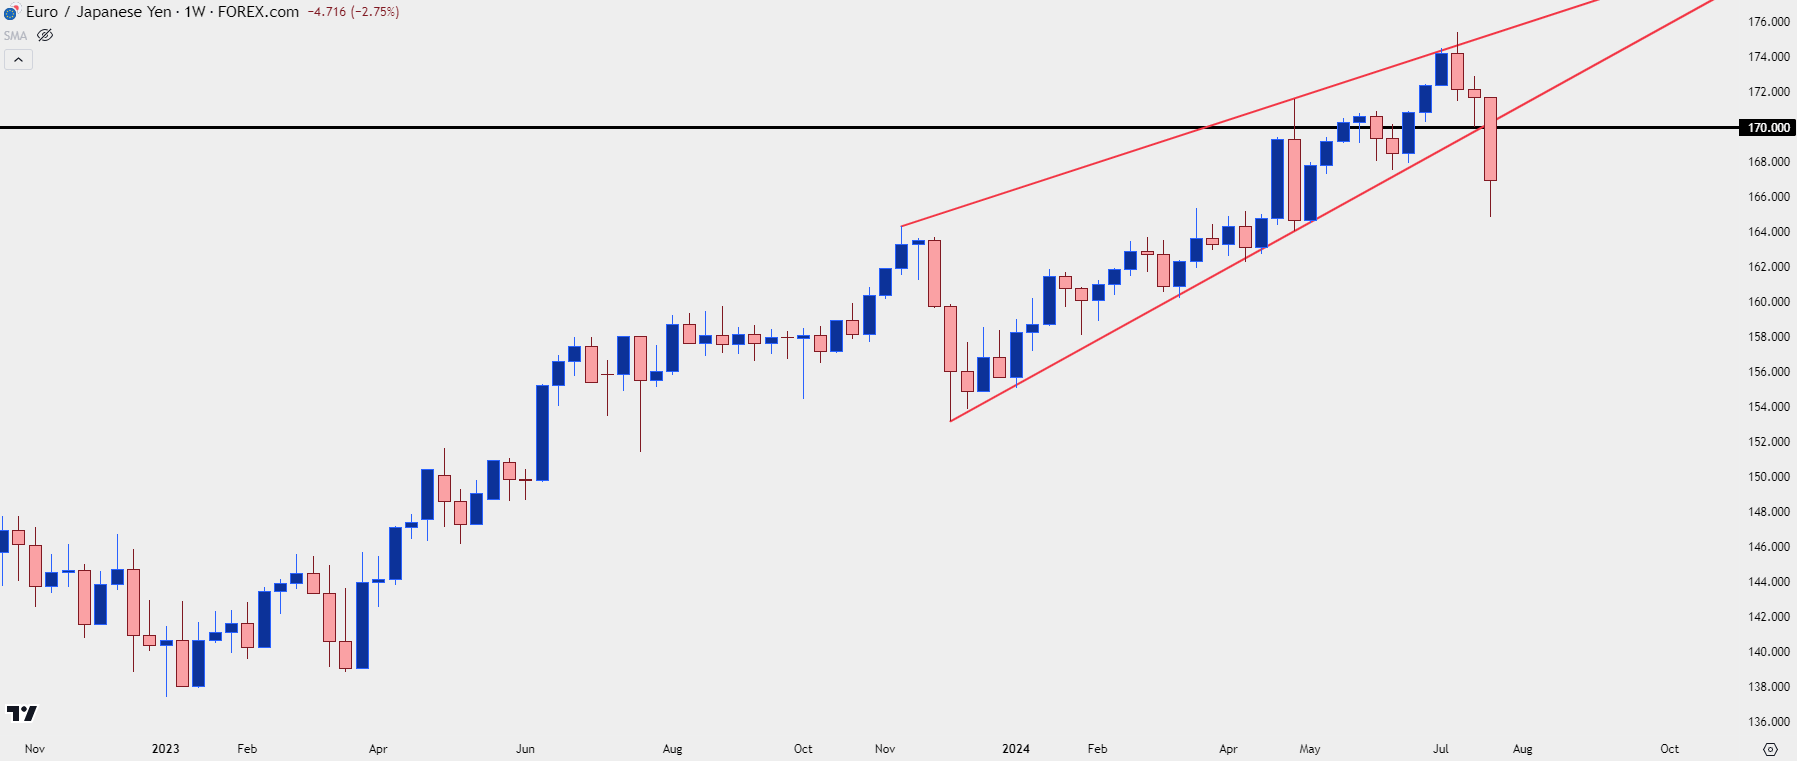
That 170.00 level took months for bulls to gain acceptance: As we can see from the below weekly chart, the first test above in late-April was greeted by a rude response with a bearish engulfing candlestick printing that week. This was, of course, driven by the Bank of Japan intervention after the USD/JPY pair hit the 160.00 level, and in both cases there was a lack of follow-through, with bulls jumping back on the bid to drive prices right back up to 170.00.
The second test of 170.00 was a bit more traditional, where buyers first tried and failed to hold the move above the big figure, but the second test a month later, in June, held, as bulls continued to drive the breakout for a couple of weeks after.
There was another BoJ intervention after the US CPI report on June 11th, and that shows a bearish engulf on the weekly which has since led to follow-through; and last week is when prices finally fell back-below the 170.00 handle that also denotes a bearish break of the rising wedge pattern.
EUR/JPY Weekly Price Chart
 Chart prepared by James Stanley, EUR/JPY on Tradingview
EUR/JPY Shorter-Term
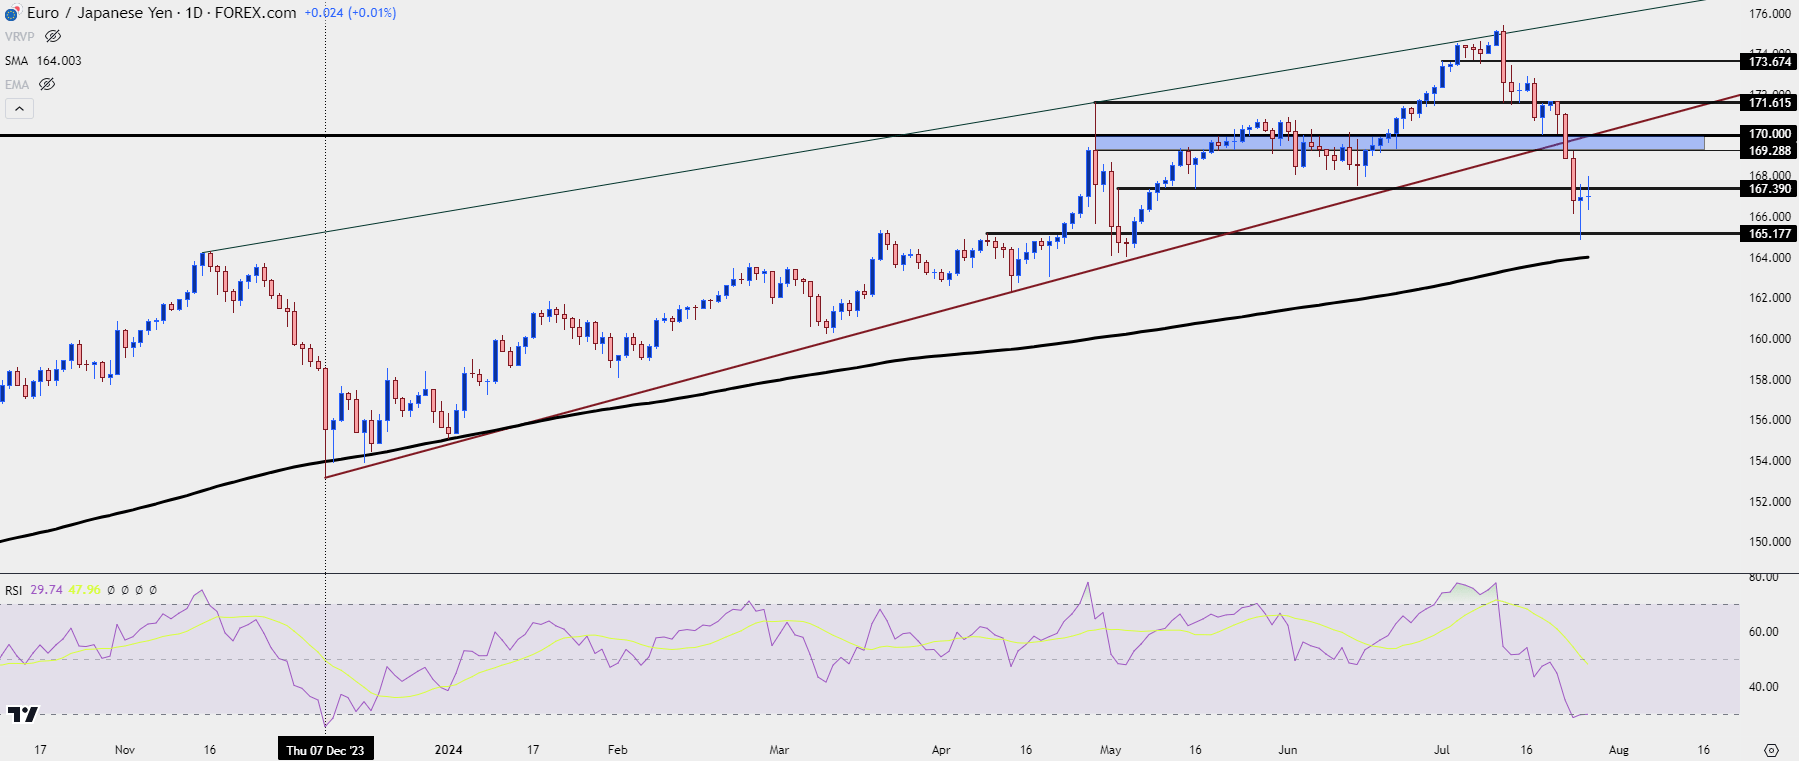
From the above weekly chart, EUR/JPY starts to take on a bearish tonality but when looking at the daily, we can see how quickly the move has pushed into oversold territory for the first time since December of last year. The pair was testing the 200-day moving average at the time and that instance marks the current 11-month low in the pair.
This combines with a doji on the daily chart after the knee-jerk move on Thursday. This could be a very difficult area for sellers to chase the move lower and, conversely, it could be setting up bullish swing potential for a pullback, with a possible re-test of resistance at prior support, taken from the 170.00 zone.
That's the major test for bulls next week, whether they can push back above the 170.00 level. If they fail to do so, then the door opens for deeper breakdown potential in the longer-term move, and with a BoJ rate decision on the calendar for next week that's a scenario that must be entertained at this point. With the ECB having already cut rates and the Fed expected to lay the groundwork for their own rate cuts, longer-term bulls holding due to the carry could gain even more reasons to square up positions and that could add further pressure to the sell-off, oversold RSI or not.
EUR/JPY Daily Price Chart
 Chart prepared by James Stanley, EUR/JPY on Tradingview
--- written by James Stanley, Senior Strategist


