Euro, EUR/USD, NFP Talking Points:
- The EUR/USD sell-off that held into the end of Q1 has went into reversal so far to begin Q2.
- The U.S. Dollar hit resistance at 105.00 on Monday of this week and that’s the same level that had held the highs in February. Since that resistance inflection, prices have been pulling back in both DXY and EUR/USD, setting the stage for tomorrow’s Non-farm Payrolls (NFP) report.
- This topic will be front-and-center for the price action webinar, which you’re welcome to attend. It’s free for all to register: Click here to register.
- The Trader’s Course has been launched and is available from the below link. The first three sections of the course are completely open and this focuses on fundamental analysis, technical analysis and price action.
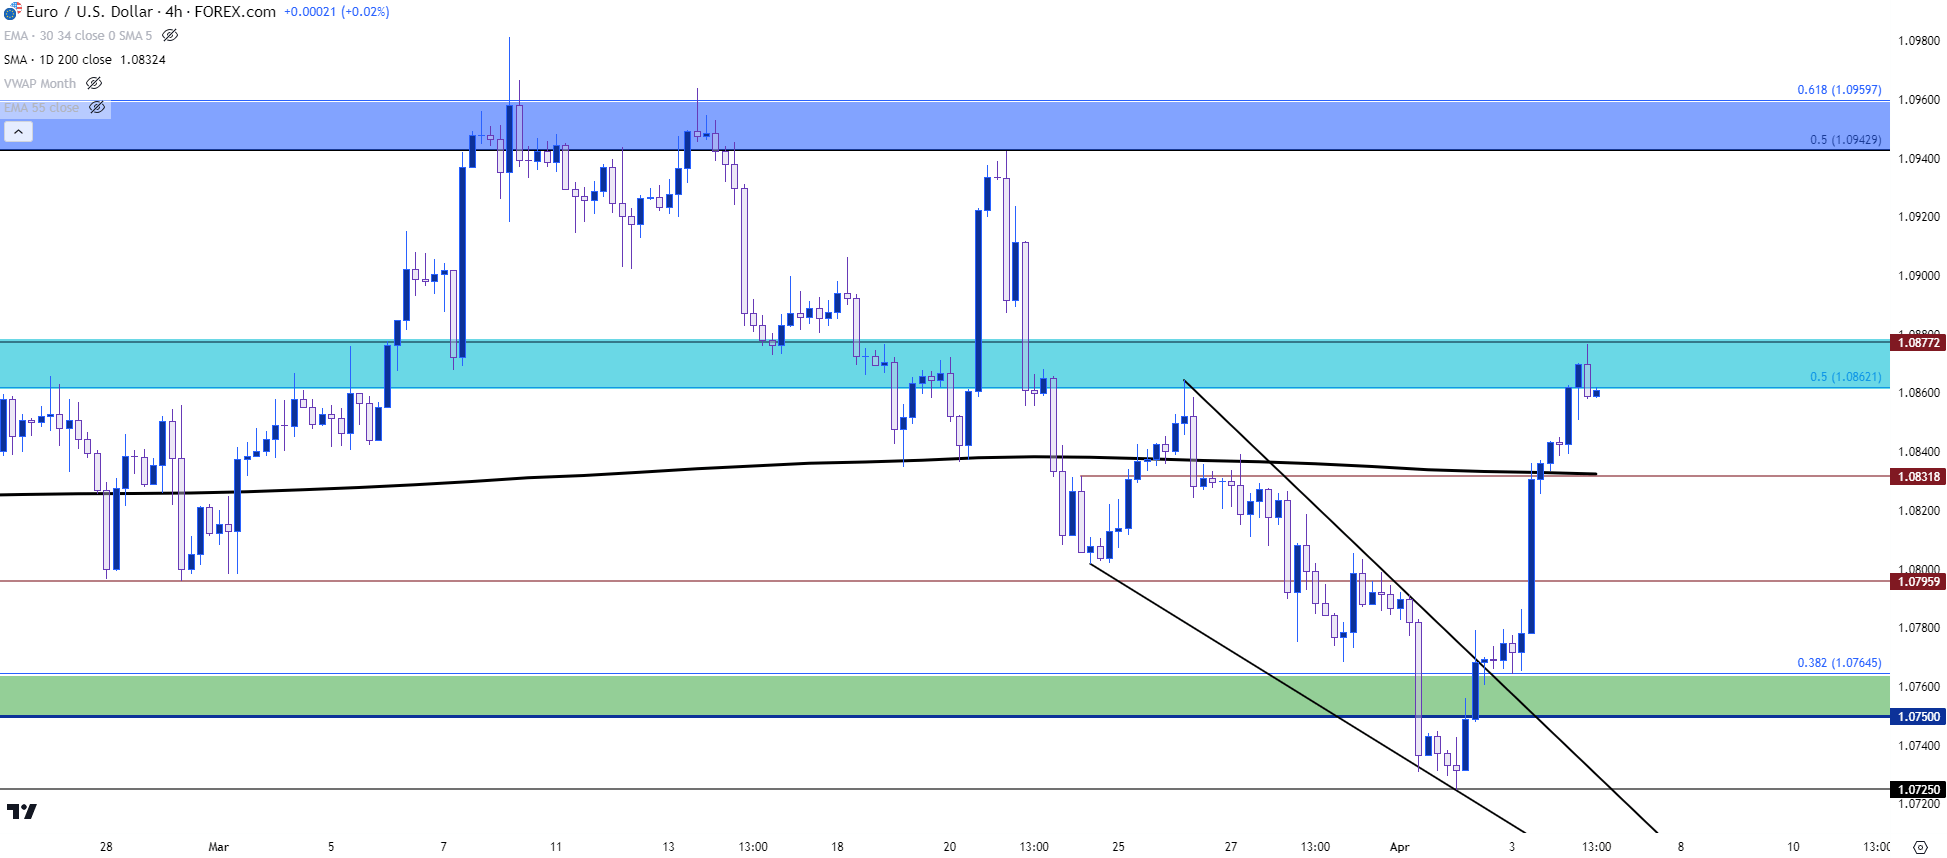
The EUR/USD rally has continued with price pushing up to the next zone of resistance. The sell-off in the pair on the heels of the March FOMC rate decision was fast and aggressive, and that extended on Monday to open Q2, creating a falling wedge formation along the way. Tuesday saw bulls stepping back into the picture and pushing a breakout from that formation and that was happening alongside the USD resistance test at the 105-handle on DXY.
That led to a deeper pullback in both markets, with EUR/USD rushing up to resistance at 1.0832 which was confluent with the 200-day moving average, after which bulls pushed up to the Fibonacci level at 1.0862 which remains in-play as of this writing. This provides for a couple of spots for bulls to hold a higher-low, such as that 1.0832 level which is where the 200-day plots currently, or down to the 1.0796 support.
EUR/USD Four-Hour Price Chart
 Chart prepared by James Stanley, EUR/USD on Tradingview
Has the USD Topped? Or Is this a Temporary Reprieve?
Given the backdrop with Non-farm Payrolls on the docket for tomorrow, it’s worth looking at the USD for directional questions on EUR/USD. And as that bullish move began in EUR/USD on Tuesday of this week, it went along with a pullback from the 105.00 level in DXY, the same spot that held resistance in Q1 before a reversal appeared.
The big question now is whether price will continue to push down towards prior support, or whether bulls can hold a higher-low to push a third test of that resistance at the 105.00 handle. And if that happens then it can bring consequence to EUR/USD, as well.
From a fundamental point of view, employment data in the U.S. has considerable importance right now as the labor market has remained strong even as the Fed has retained a dovish outlook. If that labor market strength continues, it can bring even more questions to the Fed’s rate cutting plans for later this year. Meanwhile, European inflation came in soft earlier this week; so continued strength in U.S. data can further expose a deviation between economic performance in the two economies.
And the big question still remains as to whether the Fed will cut rates before the ECB. Any mounting evidence otherwise could substantiate strength in the U.S. Dollar against the Euro and weakness in the EUR/USD pair.
At this point, the U.S. Dollar is holding support at the 103.98 level, which I had looked at in yesterday’s article on U.S. Dollar price action setups. Just below is the 200-day moving average, currently plotting at 103.79.
U.S. Dollar Daily Price Chart
 Chart prepared by James Stanley; data derived from Tradingview
EUR/USD Big-Picture
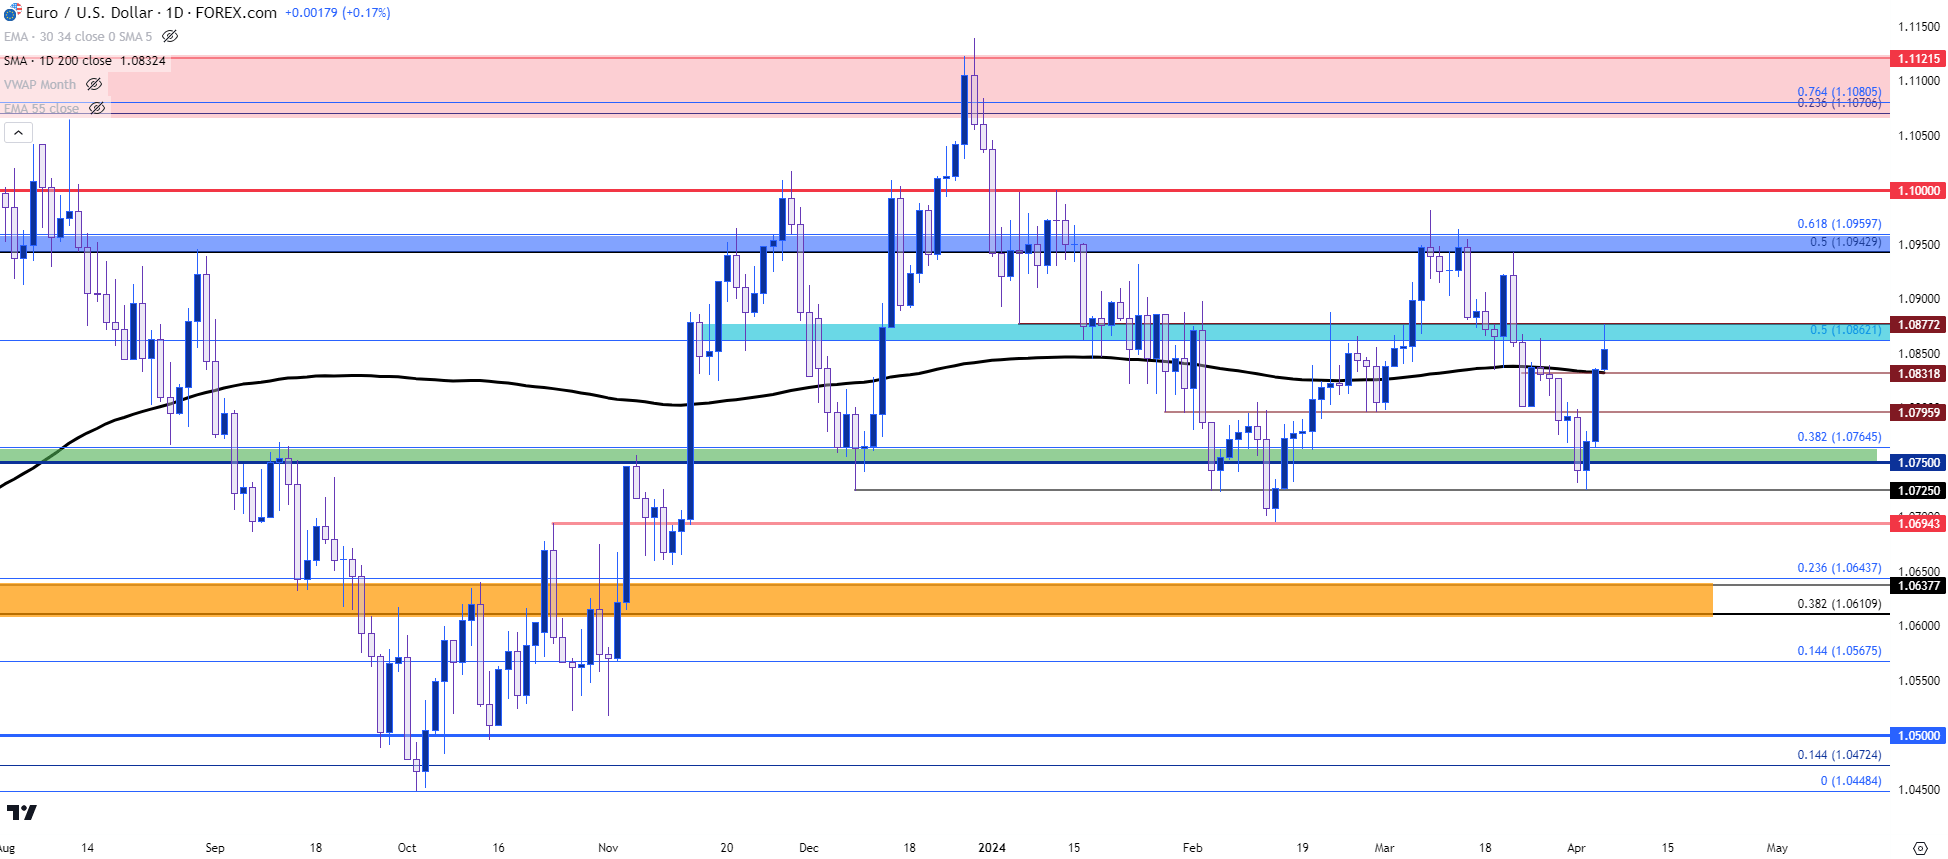
The 1.0862 level that’s come in as resistance so far today was the same that was support ahead of the March FOMC rate decision. That’s also the 50% mark of last year’s major move, from the trend spanning the high in July to the low in October. And this highlights the bigger picture backdrop behind EUR/USD, which has been range-bound for the past 15 months.
The downside of such a scenario is that trending potential can be seen as diminished, given the length of that mean reversion. The upside, however, is that there’s a number of levels on either side of price that could be of interest for swings.
On the support side of the matter, there’s the confluent spot at 1.0832 that’s nearby, with the 1.0796 level just below that. The 1.0750-1.0766 spot remains of interest, as well, with 1.0725 and 1.0696 underneath that zone. On the resistance side of the pair, the 1.0862-1.0877 zone would be the first for bulls to push through for continuation scenarios, after which the 1.0943-1.0960 zone comes back into the picture and this was the resistance that held the highs for about two weeks, including that post-Fed rally, until bears were able to take control into the Q2 open.
EUR/USD Daily Price Chart
 Chart prepared by James Stanley, EUR/USD on Tradingview
--- written by James Stanley, Senior Strategist


