Euro Talking Points:
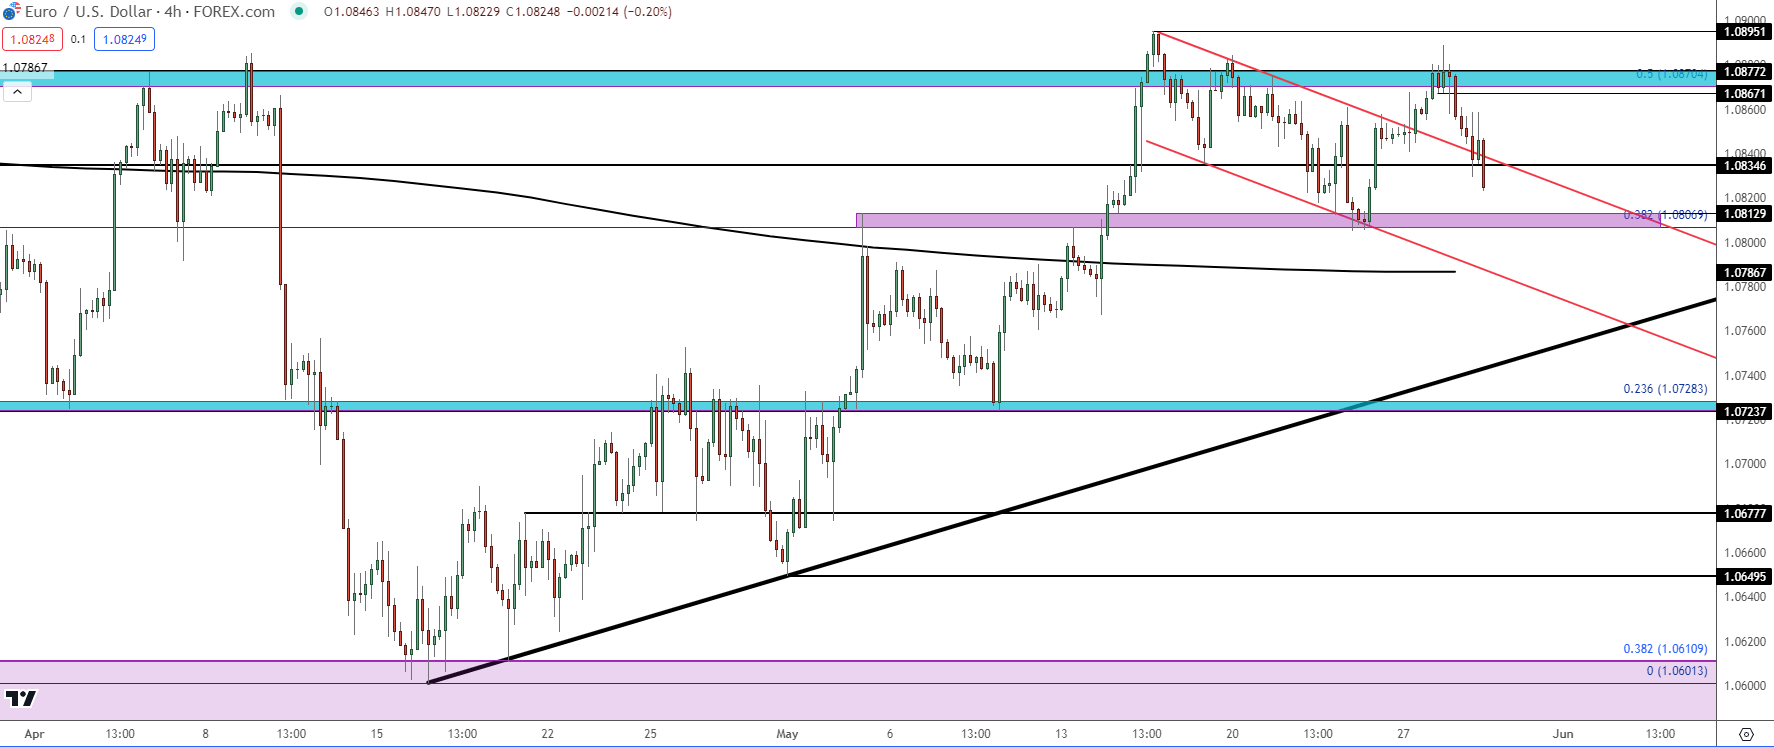
- EUR/USD has retained relatively strong footing against the US Dollar, building and then breaking out of a bull flag formation.
- The breakout from the formation to begin this week wasn’t able to get very far, however, as price got caught in the same zone of resistance that had previously helped to hold the highs around the 1.0870 Fibonacci level.
- Next Thursday brings the European Central Bank rate decision and there’s wide expectations for the bank to announce a rate cut. The ECB no longer offers forward guidance, so the big question is whether the bank lays the groundwork for another cut in the not-too-distant future.
- I’ll be discussing these themes in-depth in the weekly webinar. It’s free for all to register: Click here to register.
EUR/USD has shown strength for more than six weeks now.
It was mid-April and the pair was bristling lower after the release of US CPI. At the time, there was a fairly clear deviation between European and US economies, as inflation had already softened quite a bit in Europe while it had become a bit stickier in the US, bringing to question the Fed’s ability to cut rates in the next few months.
EUR/USD soon began re-test of longer-term range support, right around the 38.2% Fibonacci level from the 2021-2022 major move. The bounce started slowly but took on a new life after the FOMC rate decision on May 1st, with another major boost two days later on the back of Non-Farm Payrolls. That led to a push up to the 200-day moving average, which held the highs for the next week-and-a-half.
It was the next release of US CPI that really sparked the fuse for bulls, allowing for a topside breakout and a push up to a fresh monthly high. Since then, however, bulls have largely been thwarted.
The digestion of that breakout showed in a symmetrical fashion, taking on the form of a bearish channel which, when matched with the prior bullish trend, set up a bull flag formation, which began to breach in the early-portion of this week.
EUR/USD Four-Hour Price Chart
 Chart prepared by James Stanley, EUR/USD on Tradingview
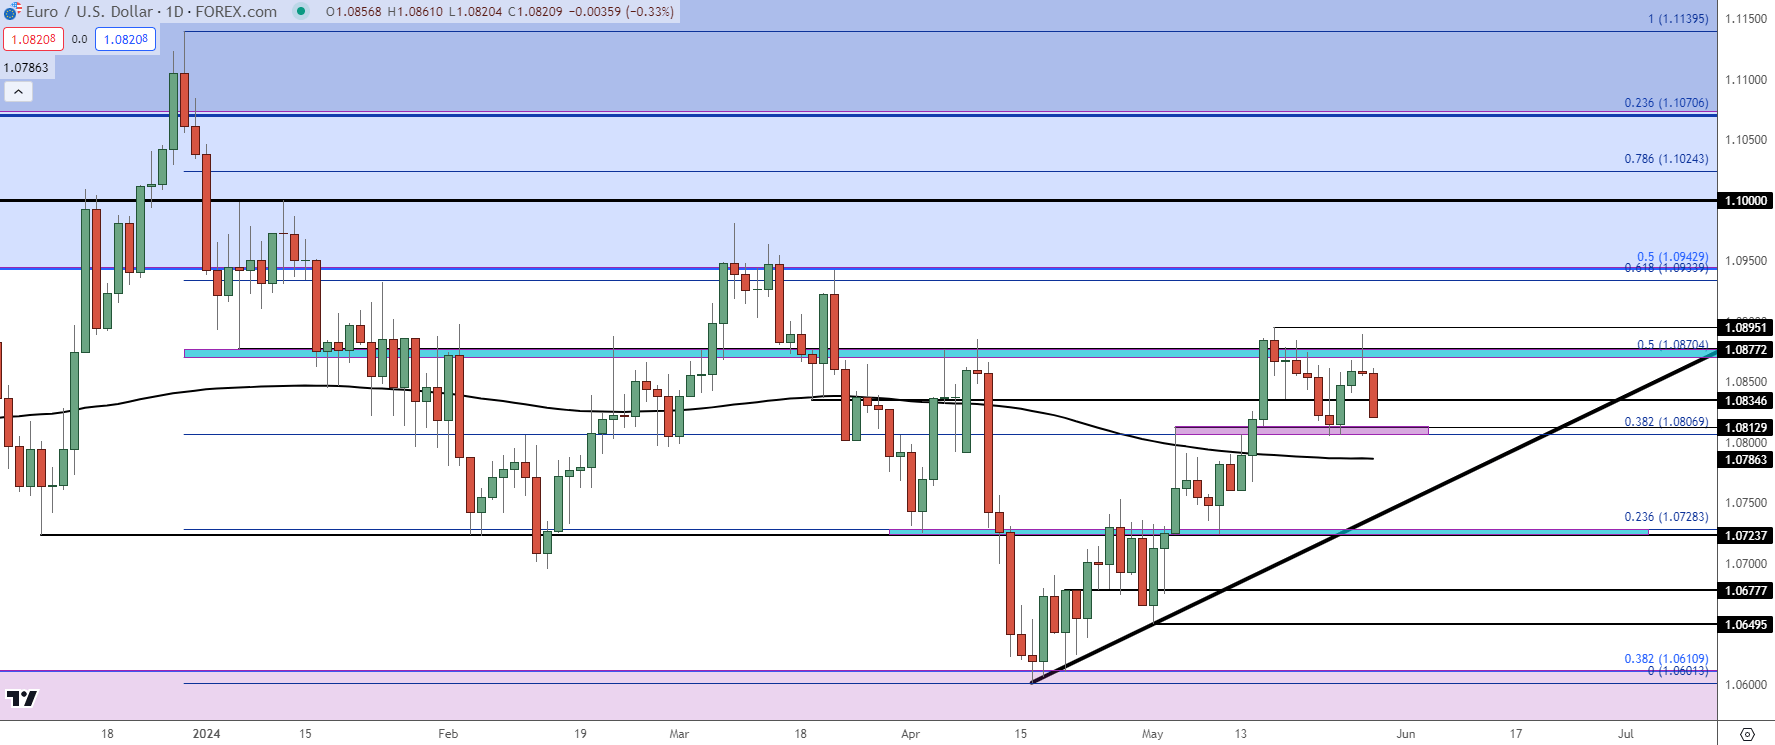
Taking a step back on the chart begins to highlight the range that’s been in-play for almost 17 months now; and from the daily chart, there’s still a bullish case as price has continued to hold higher-highs and higher-lows since the support hit at 1.0611 last month.
The turn-around on Tuesday shows a daily candle as a gravestone doji, which is usually highlighting indecision with a bearish element involved given the failure from bulls to hold the move. And that has, so far today, continued-lower.
The daily chart also highlights two important spots of support: Nearby is the 1.0807-1.0813 zone which has already held the lows once when it came into play last week. And a little lower is the 200-day moving average, which hasn’t yet been re-tested for support since the breakout.
If bulls fail to hold either of those levels, the bullish trendline could come into play and that currently projects to around 1.0740.
EUR/USD Daily Price Chart

Chart prepared by James Stanley, EUR/USD on Tradingview
EUR/USD: Scenario Plotting
There’s a couple of large drivers on the horizon. This Friday brings the next major piece of inflation data out of the US with Core PCE, and then next Thursday brings the European Central Bank rate decision. With the ECB expected to cut rates, this puts a lot of emphasis on the Core PCE report. If it comes out hot, the divergence between Europe and the US is even more visible and that can be excuse for bears to take a shot. But, if it comes out soft then we’ll likely see markets firming odds for a more near-term rate cut out of the Fed which could soften the blow, and perhaps even give bulls an excuse to run the trend given the current bullish technical construction.
If the bullish scenario does take place, there’s a couple of additional spots for resistance sitting overhead: The 1.0943 Fibonacci level is the 50% mark of the same study from which the 1.0611 level comes from. And then the psychological level at 1.1000 has already produced two rigid resistance reactions so far this year.
On the bearish side of the pair, the US Dollar comes into focus as the currency is continuing to bounce from the 200-day moving average, and much like we saw in April, if there is stall shown with inflation figures out of the US, the EUR/USD pair can drop very quickly.
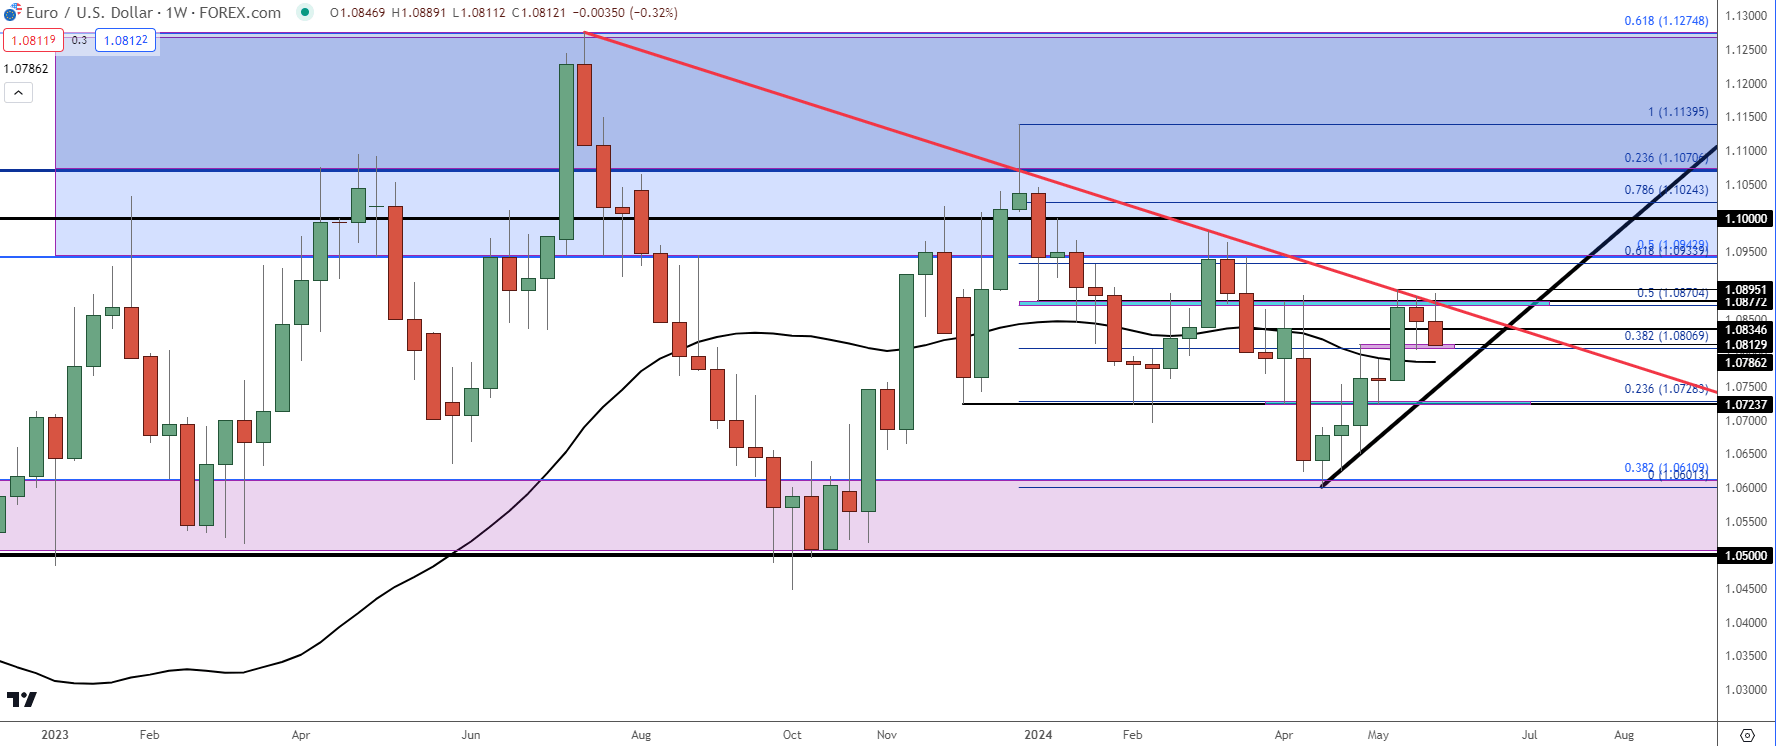
At that point, we would be considering trend potential and that’s where the weekly chart comes back into the picture as EUR/USD has been in a range for more than a year now. But – if sellers can run a short-term breakdown, the next item of support shows around 1.0725, and then below that is the longer-term range support.
The start of that longer-term support zone is the 1.0611 Fibonacci level, but that spans all the way down to the 1.0500 psychological level which could offer some potential for short-term bearish trends if sellers can continue to grind through supports.
EUR/USD Weekly Price Chart
 Chart prepared by James Stanley, EUR/USD on Tradingview
--- written by James Stanley, Senior Strategist


