Euro, EUR/USD Talking Points:
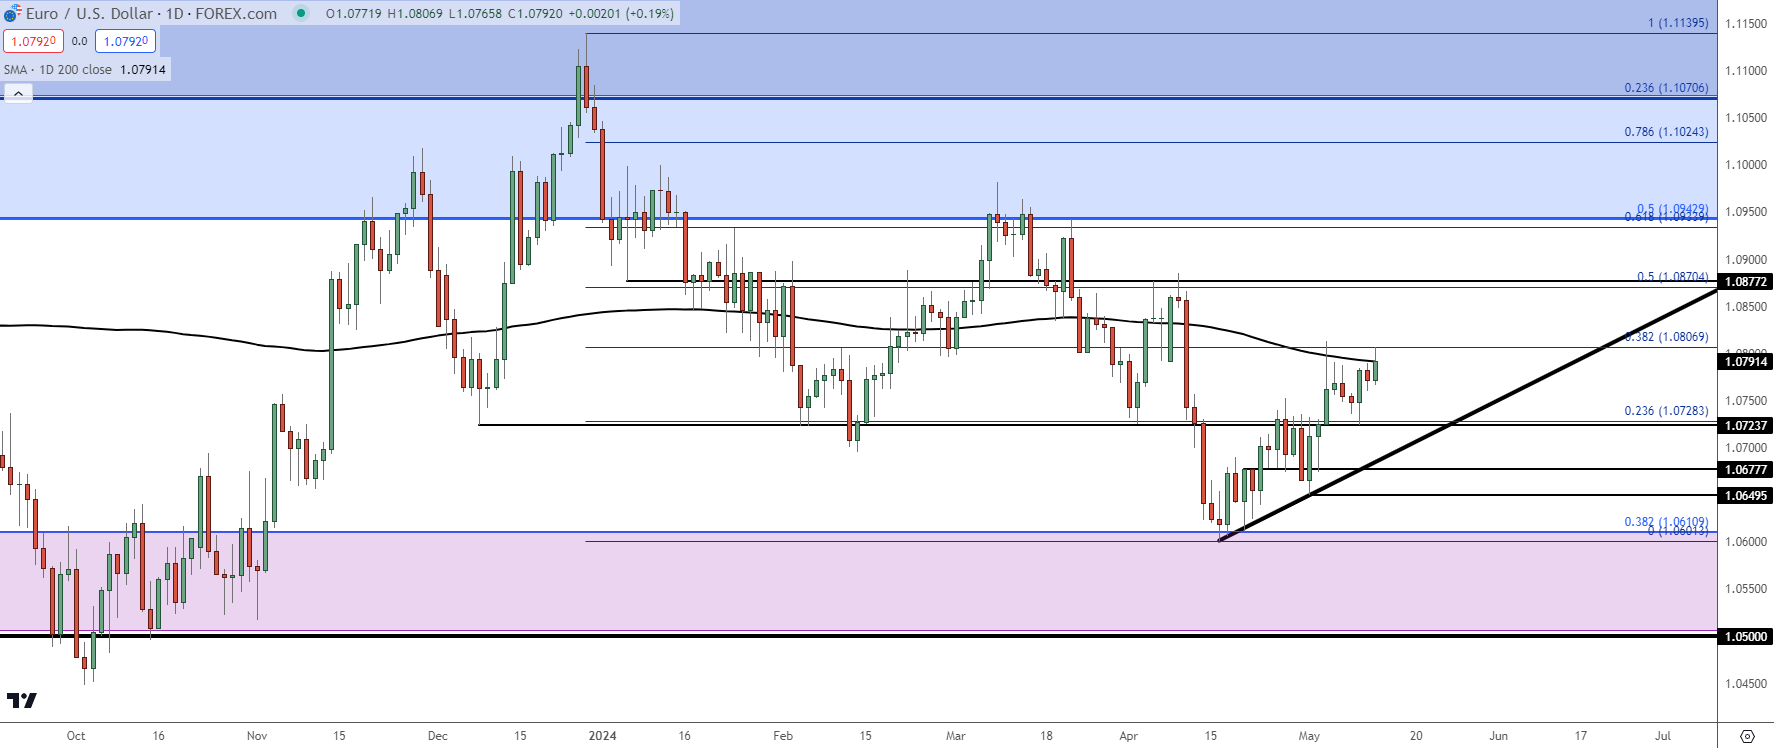
- EUR/USD has continued the bounce from 1.0725 that started last Thursday, and the pair is now re-testing the 200-day moving average.
- EUR/USD had previously tested the 200-dma as resistance on NFP Friday, which led to a pullback. But bulls held a higher-low at prior resistance of 1.0725 and that’s allowed for another re-test of the moving average. The big question now is how the USD and related pairs, especially EUR/USD, perform around the Wednesday release of CPI.
- I’ll be discussing these themes in-depth in the weekly webinar. It’s free for all to register: Click here to register.
EUR/USD is making another effort to break above the 200-day moving average and this is a situation that could be impacted dramatically on Wednesday after the release of US CPI.
In April, the US Dollar was rushing higher, and EUR/USD lower as strong US data brought question to the Fed’s ability to start cutting rates this year. And initially what started off as a stall at support, with EUR/USD clinging to 1.0611, has started to take on the form of a fresh trend as helped by the FOMC rate decision two weeks ago, and the NFP report that followed.
The NFP release earlier this month was the first time that data printed below expectations since last November, and it was the FOMC rate decision on November the 1st where the bank sounded more dovish than usual. Through this year, US data has remained relatively strong even despite the Fed’s ongoing dovishness, and that’s helped the USD to hold on to strength to varying degrees.
But the impact of that below-expected NFP report can be seen vividly on the below chart, as that’s the swing high that current holds the monthly high in the pair. It was also the first re-test of the 200-day moving average since April 10th, which was the last CPI release out of the United States, and this sets the tone for the next CPI release scheduled for Wednesday.
Like NFP, CPI has been all meets or beats since the data release in November. If this prints below-expected, like NFP did earlier in the month, that would be the first instance on a really important inflation indicator, and this could drive further weakness into the USD as rate cut hopes could get a bit more positive based on trends in the data.
EUR/USD Daily Price Chart
 Chart prepared by James Stanley, EUR/USD on Tradingview
EUR/USD Longer-Term: The Range Remains
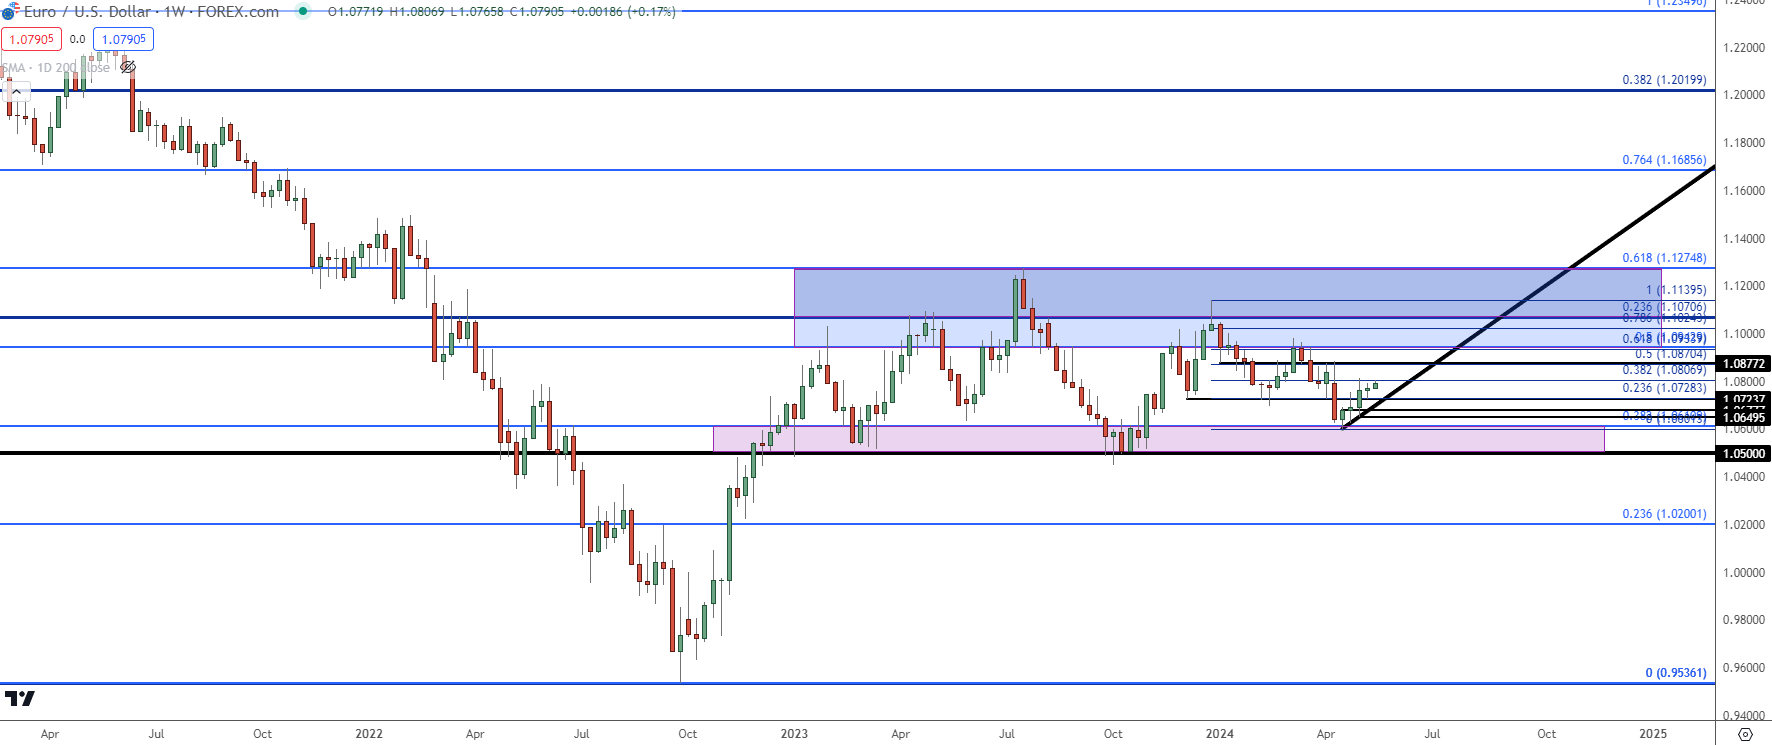
On a longer-term basis EUR/USD remains in the same range that’s been in-play since the start of 2023 trade. The Fibonacci retracement produced from the 2021-2022 major move continues to hold some attraction and it was the 38.2% marker from that setup that caught the lows last month.
Similarly, the 50% marker helped to form resistance in March and it was the 61.8% retracement that caught the high last year.
The question at this point, particularly with the 200-dma coming back into play and the CPI report on the calendar for this Wednesday, is whether bears can hold a lower-high, inside of that 1.0943 level, to provoke a deeper test of support. The zone runs all the way down to 1.0500 so theoretically bears could take their shot while the range remains in order.
EUR/USD Weekly Price Chart
 Chart prepared by James Stanley, EUR/USD on Tradingview
EUR/USD Shorter-Term
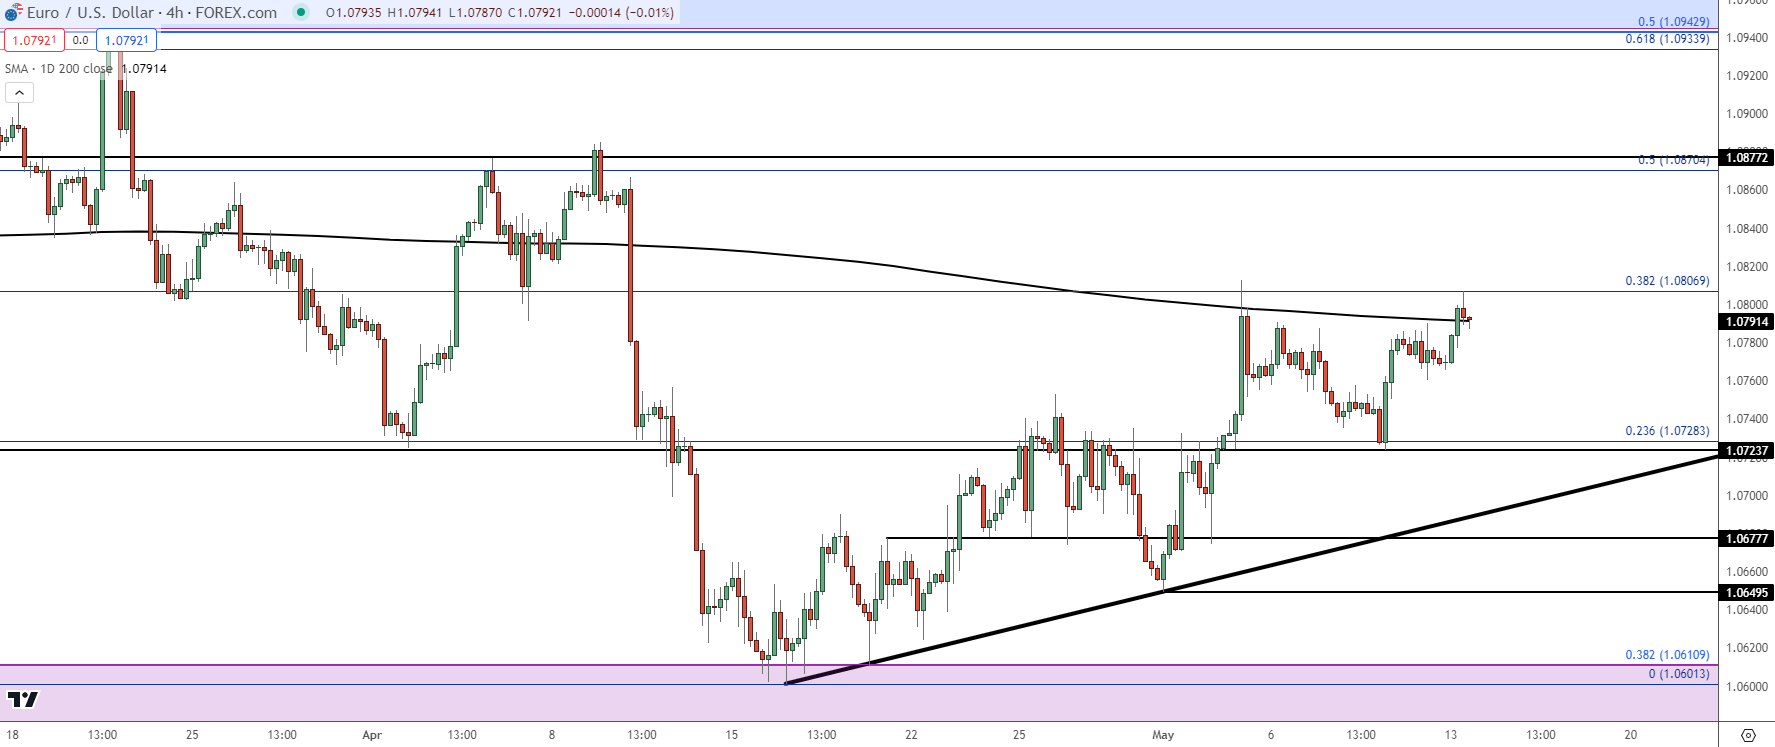
At this point from the shorter time frames, the range is most pertinent given that the bullish leg of that move has already started. For that scenario, the next notable spot of resistance appears around 1.0877, after which the 1.0943 level comes into the picture.
But it’s important to keep in mind how impactful that Wednesday CPI release can be. At this point markets have been running a clean pattern of risk-on scenarios after the FOMC and NFP drivers. If CPI unsettles that with another above-expected print, there could be some fast re-pricing to be seen. For that theme, 1.0725 support is important for bulls to hold to retain control of the near-term trend. Below that there’s a bullish trendline drawn from April and May swing lows and if bears can punch through that, the door opens to re-tests at 1.0677 and 1.0650, after which the ‘big picture’ support zone comes back into play starting at 1.0611.
EUR/USD Four-Hour Price Chart
 Chart prepared by James Stanley, EUR/USD on Tradingview
--- written by James Stanley, Senior Strategist


