Euro, EUR/USD Talking Points:
- EUR/USD continues to hold within that range that’s been in-play for a year and a half, even after June rate decisions showed deviations between the respective central banks with the ECB cutting and the Fed sounding a bit more-hawkish in their forecasts.
- There is some headline risk on the horizon, with tomorrow’s release of Core PCE data and next week’s first round of European elections (with the second round a week later). The big question is whether or not there’s enough motivation for traders to breach the range that’s continued to compress through 2024 trade.
- I’ll be discussing these themes in-depth in the weekly webinar. It’s free for all to register: Click here to register.
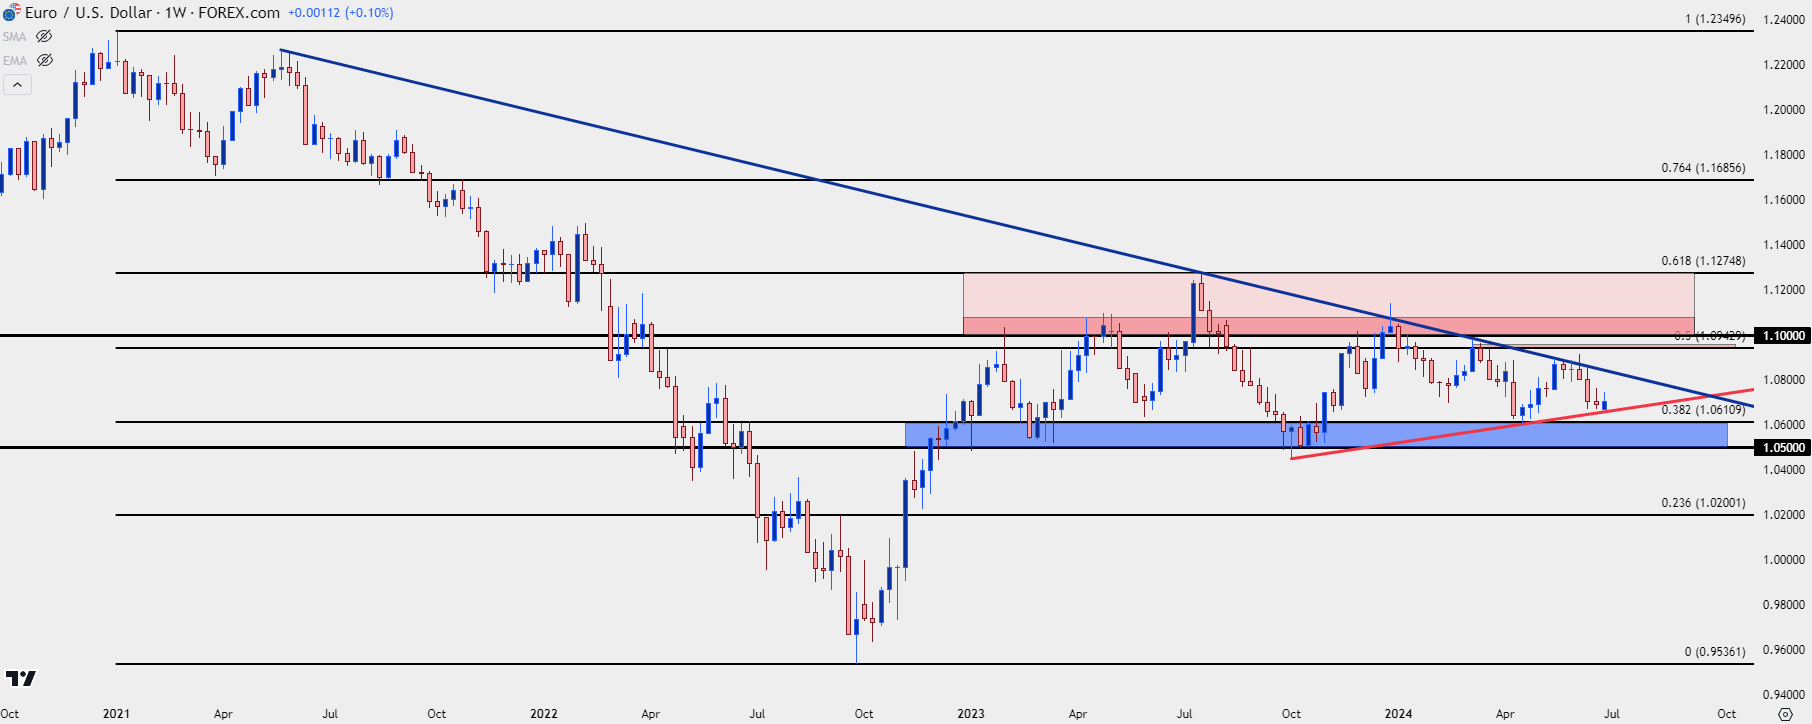
There was a blistering trend in EUR/USD for most of 2021 and through the first nine months of 2022. And then there was a strong and decisive 50% retracement of that trend in the three months that followed. But, since then, it’s been range-bound behavior for the world’s most popular currency pair and we’re now nearing an 18th month of that mean-reverting backdrop.
While the two economies haven’t grown in lock-step, there’s been a proclivity for each central bank to retain a similar view as the other. And if we think about the consequences of currencies, it can make sense as to why.
If the Euro goes on an extended streak of losses against the US Dollar, then reasonably, inflationary pressure will push higher on the Euro-zone. Take the case of Apple, for instance, the American computer and phone manufacturer. Let’s say that they’re hypothetically selling a Macbook for €1,000 in Q4 of 2020, when the spot rate in EUR/USD was 1.2200. For every unit sold, Apple has revenue of $1,220 (€1,000 x 1.22 - $1,220).
Now let’s fast forward to Q4 of 2022, when EUR/USD hit a low of 0.9536, which means that same €1,000 sale of a Macbook is now only bringing back $953.60 in revenue to Apple in the United States. That’s a difference of $266.40, or 21.8%, and this is simply due to a currency exchange issue. This is a massive hit to Apple’s margins and in the case of many products, it can be the difference between a profit and a loss.
So, is Apple just going to take that, or are they going to adjust prices to offset the difference? Normally we’ll see companies choose the latter route, which means higher prices in Europe to offset for the weaker currency. But it doesn’t end there as other players in the market see Apple charging higher prices and they, too, want in on the action. This can lead to price hikes from other companies, on other products, and this becomes a driver of inflation.
After the 2021-2022 episode when the Euro lost more than 22% of it’s value to the US Dollar, there’s been a noticeable shift at the respective central banks where neither has appeared to want to be out of sync with the other. And thus, the pair has held within a range for the past year-and-a-half, as shown on the below weekly chart of the EUR/USD pair.
EUR/USD Weekly Price Chart
 Chart prepared by James Stanley, EUR/USD on Tradingview
Will Data, Drama Allow for the Range to Continue?
For much of the past year we’ve heard both central banks talking up the prospect of rate cuts. The data divergence however has allowed the ECB to cut while the Fed is still waiting to do so. And to be sure, there have been shorter-term trends inside of this big picture range, such as the move that built from July of last year into October, which was the last time that EUR/USD tested range support at the 1.0500 handle.
Taking a longer-term look at the matter and that 1.0500 level seems critically important, as this was the same price that held lows in 2015 and 2016. It was penetrated for five months in 2021 and that’s around the time that the ECB suddenly got more-hawkish, hiking rates in 75 bp increments around the same time the Fed was stepping back down to 25 bp rate hikes.
But it was the pair trading below that level that seemed to get the attention of the European Central Bank and ever since the retracement pushed price back above in December of 2022, that level has been support for the range.
EUR/USD Monthly Price Chart
 Chart prepared by James Stanley, EUR/USD on Tradingview
Euro and U.S. Drivers
There’s been some drivers in the past few weeks and months that could be construed as bearish for EUR/USD. The rate cut around the same time that the Fed sounded a bit more hawkish certainly could fit that bill, as well as the possible volatility in upcoming elections in France, where Marine Le Pen is expected to make it to the second round of voting a week later.
But perhaps more noticeable to currency markets has been the ECB’s evasiveness on future rate moves, and this speaks to a structural shift that the bank undertook that may actually offer some advantage against the Fed.
The ECB removed forward guidance for rates in July of 2022, right around the time that the pair was testing the parity level (1.0000) in the EUR/USD pair. Forward guidance was a key part of the Fed’s strategy in the wake of the Financial Collapse, designed to give investors motivation to invest in riskier endeavors by ensuring them that the central bank had no aim of tightening the monetary backdrop anytime soon.
In a flat or falling rate environment, that forward guidance can work great, as it gives investors reason to look at higher beta issues. But, in a rising rate environment it can take on a new life, as bond markets looking on the horizon see a central bank that’s essentially trying to make their lives more difficult, as rising rates will sink the value of currently held bond portfolios.
This helps to explain the quagmire that we’ve seen in the US, where higher rates have had little effect (so far) on items like home prices or even inflation. With the Fed continuing to forecast rate cuts in their economic projections, investors have had reason to hold on and wait.
As a case in point, markets are still discussing how many times the Fed might cut rates this year even with a strong labor market and inflation that’s stuck above 3% on both Core and Headline CPI prints.
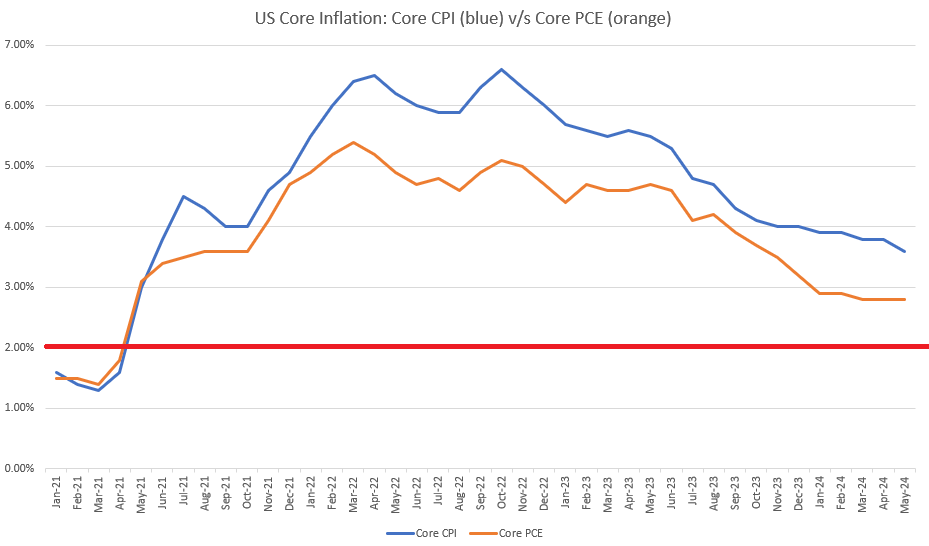
But, on that tune, we’ll be receiving another piece of inflation data tomorrow and this is something that can drive markets. The Fed’s ‘preferred inflation gauge’ of Core PCE was more favorable earlier in the year as that data point had continued to drop even as CPI had started to stall. More recently, however, it’s been Core PCE that’s been stalled as the past three months have all printed at 2.8% (technically, it’s four months but the January data released in February was revised up to 2.9%), giving rise to the fear of ‘inflation entrenchment,’ a risk noted by Jerome Powell last year when discussing the possible end to rate hikes. This stall likely played a role in the Fed’s slightly-hawkish shift at the June FOMC rate decision, and it’s on center stage tomorrow as we move into the end of the week.
That data is shown below as I’ve plotted both core inflation figures along with a red line at the Fed’s target of 2%.
Core Inflation Data in the U.S. (CPI in Blue, PCE in orange)

Chart prepared by James Stanley
EUR/USD Shorter-Term
Given the elongated length of the range, there’s been a slowing of sellers over the past couple of weeks as that longer-term range support has come into play.
The last test of range support was mid-April, a few days after the CPI report drove USD strength; but the pair failed to breach below 1.0600 and bulls then had their way for the next month-and-change. But, once again, strong US data prevailed as the NFP report helped to push the pair back down, with another extension after the FOMC rate decision which helped to set a local low at the 1.0668 level.
That price has since held support, showing potential as a higher-low above that range support.
If Core PCE comes out soft tomorrow, with the expectation at 2.6%, this could give more motivation for pullbacks in the move with resistance potential at the 200-day moving average. There’s also a Fibonacci level of note at 1.0766.
If Core PCE comes out hot, and for that I’d be considering anything above the same 2.8% as such, the shorter-term descending triangle that’s set up could give way to downside breach, at which point bears will be forced to tangle with multiple other supports, such as Fibonacci levels at 1.0643 and 1.0611, before the 2024 low comes into play at 1.0601. And even if bears can push into 1.0601, then the longer-term support remains an issue and that can be spanned down to the same 1.0500 level looked at earlier.
EUR/USD Daily Price Chart
 Chart prepared by James Stanley, EUR/USD on Tradingview
--- written by James Stanley, Senior Strategist


