Euro Talking Points:
- It’s been a strong start to Q3 so far for EUR/USD, and in-turn, a bearish start to the quarter for the US Dollar.
- The EUR/USD pair has been range-bound for 18 months now and prices are pushing towards a re-test of range resistance. So far in 2024, that range resistance has held at lower-highs as range support has built a series of higher-lows, displaying compression within the broader context of mean reversion.
- I’ll be discussing these themes in-depth in the weekly webinar. It’s free for all to register: Click here to register.
In the month of June, the ECB cut rates while the Fed pushed their forecast in a more-hawkish direction. But, you might not know that by simply looking at the chart, as EUR/USD has pushed seven consecutive days of strength to trade at its highest level since before the ECB rate cut.
From the monthly chart, we can put that recent range into context as the consistent sell-off through 2021 and the first nine months of 2022 drove a test below the parity handle. There was a fast snap-back in late 2022 as 50% of the prior trend was retraced. But, since then, it’s been back-and-forth price action in the pair.
EUR/USD Monthly Price Chart
 Chart prepared by James Stanley, EUR/USD on Tradingview
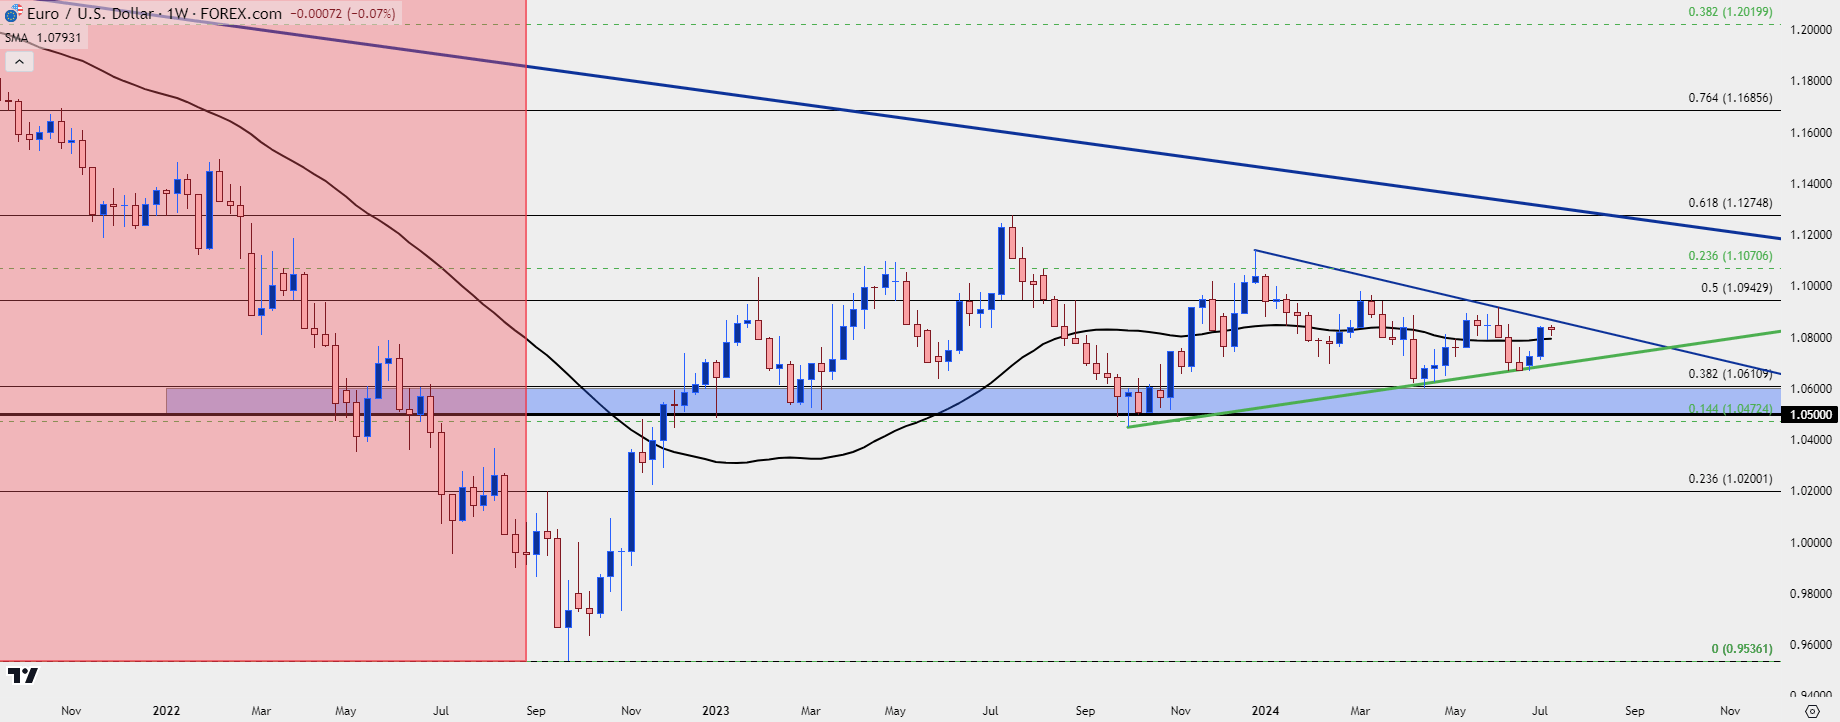
From the weekly chart, we can get better perspective on that mean reversion as the past year has shown compression within that range, accented by both lower-highs and higher-lows. This is a symmetrical triangle formation and it’s essentially showing volatility compression, often approached with aim of breakout although it’s generally considered to be direction-agnostic.
Notably, last week was the largest weekly gain for the pair since November of last year.
EUR/USD Weekly Chart
 Chart prepared by James Stanley, EUR/USD on Tradingview
EUR/USD Daily
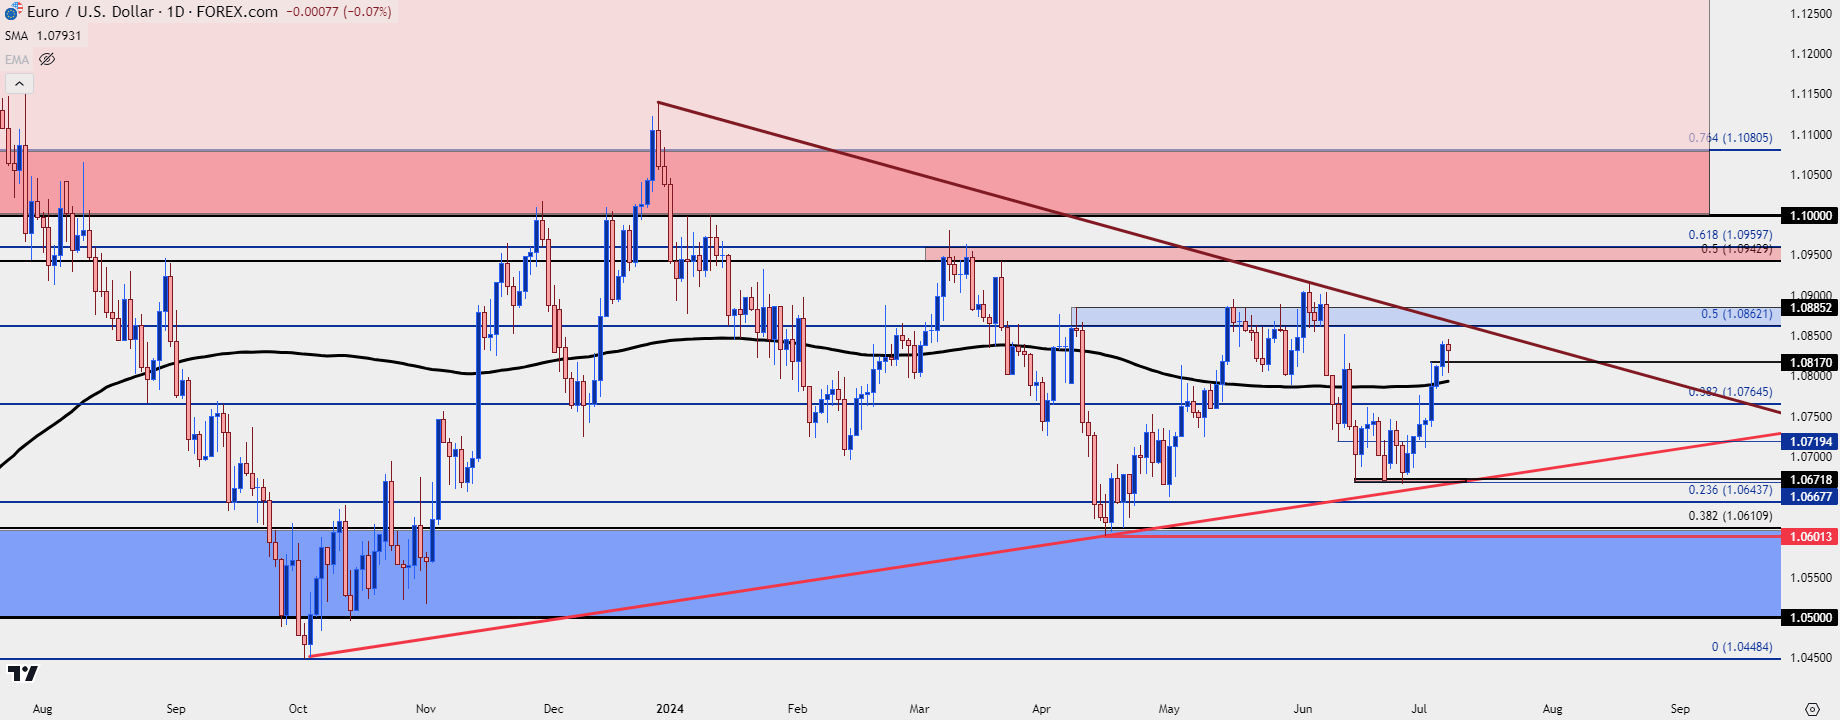
The daily chart of EUR/USD below has quite a bit more definition, and I’ve highlighted the recent series of lower-highs. In May and leading into June, there was a batch of resistance that held the highs inside of the 1.0900 level; and before that in March, resistance was defined by a zone demarcated by Fibonacci levels at 1.0943 and 1.0960.
The major psychological level of 1.1000 rests above that and this was last in-play in the opening two weeks of the New Year, helping to build a double top that triggered and filled in the month that followed.
The key takeaway here is that bulls have their work cut out for them if they are going to continue to drive.
EUR/USD Daily Price Chart
 Chart prepared by James Stanley, EUR/USD on Tradingview
EUR/USD Four-Hour
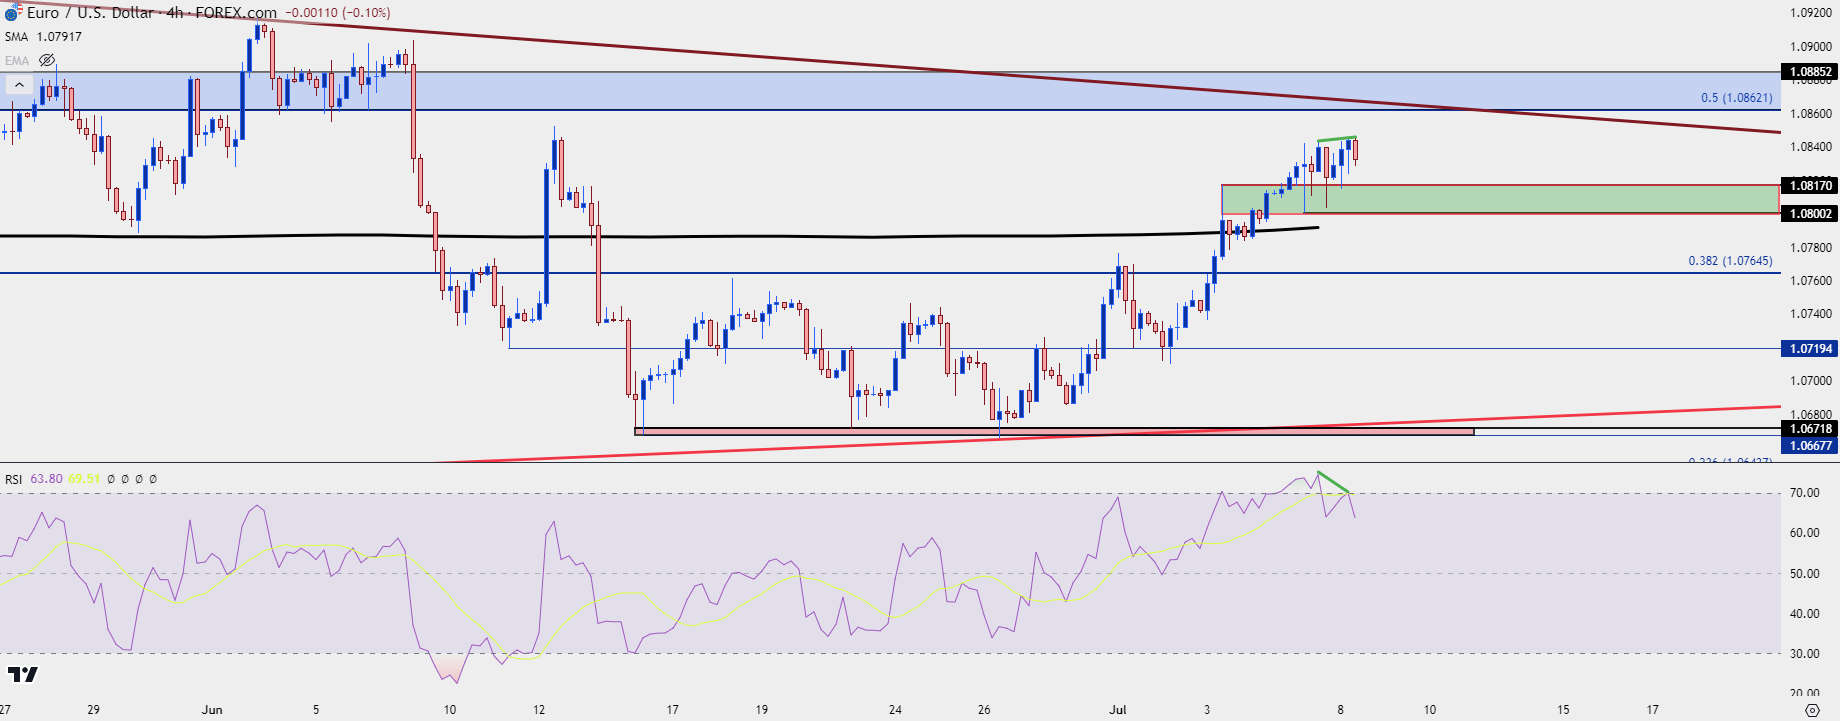
Shorter-term, we can see where the recent bullish move is starting to look a bit overdone. RSI had a recent trip into overbought territory and at this point, it appears to be brewing a case of divergence.
The 200-day moving average remains notable, and as of this writing, both EUR/USD and DXY are trading above their 200-dma. There’s a support zone taken from prior resistance, spanning from the 1.08 handle up to the prior swing high at 1.0817, and this support would be an ideal place for bulls to defend if they do want to push up for a test of longer-term range resistance.
For bearish scenarios, that 200-day moving average remains key, as a push below that highlights sellers showing more aggression and that opens the door for re-test of the Fibonacci level at 1.0766, after which the 200-dma could be re-purposed for lower-high resistance potential.
EUR/USD Four-Hour Price Chart
 Chart prepared by James Stanley, EUR/USD on Tradingview
--- written by James Stanley, Senior Strategist


