Euro Talking Points:
- EUR/USD put in a strong breakout after the US CPI report, pushing up to a fresh 2024 high, albeit barely.
- The pair then showed a sizable pullback after this morning’s U.S. retail sales data, which support showing at the same spot looked at in the Tuesday webinar, from 1.0943-1.0960.
- I’ll be looking into these setups in the Tuesday webinar and you’re welcome to join, click here for registration information.
EUR/USD has had a busy week, and really, this week’s price action has been an extension of what showed the week before.
As panic was peaking the Monday before last, the US Dollar was showing considerable weakness. EUR/USD spiked up for its first test of 1.1000 since the opening weeks of 2024 trade, and that found sellers as price started to sink back. But the pullback from that remained moderate with support holding at 1.0900, keeping the door open for bulls as we came into this week.
This then led into a few positive U.S. data reports, with PPI on Tuesday, CPI on Wednesday and then U.S. retail sales on Thursday, each of which helped to further pull markets back from the ledge with stock prices shooting-higher. This had also helped to drive a run of USD-weakness as the recession trade in Treasuries backed-off.
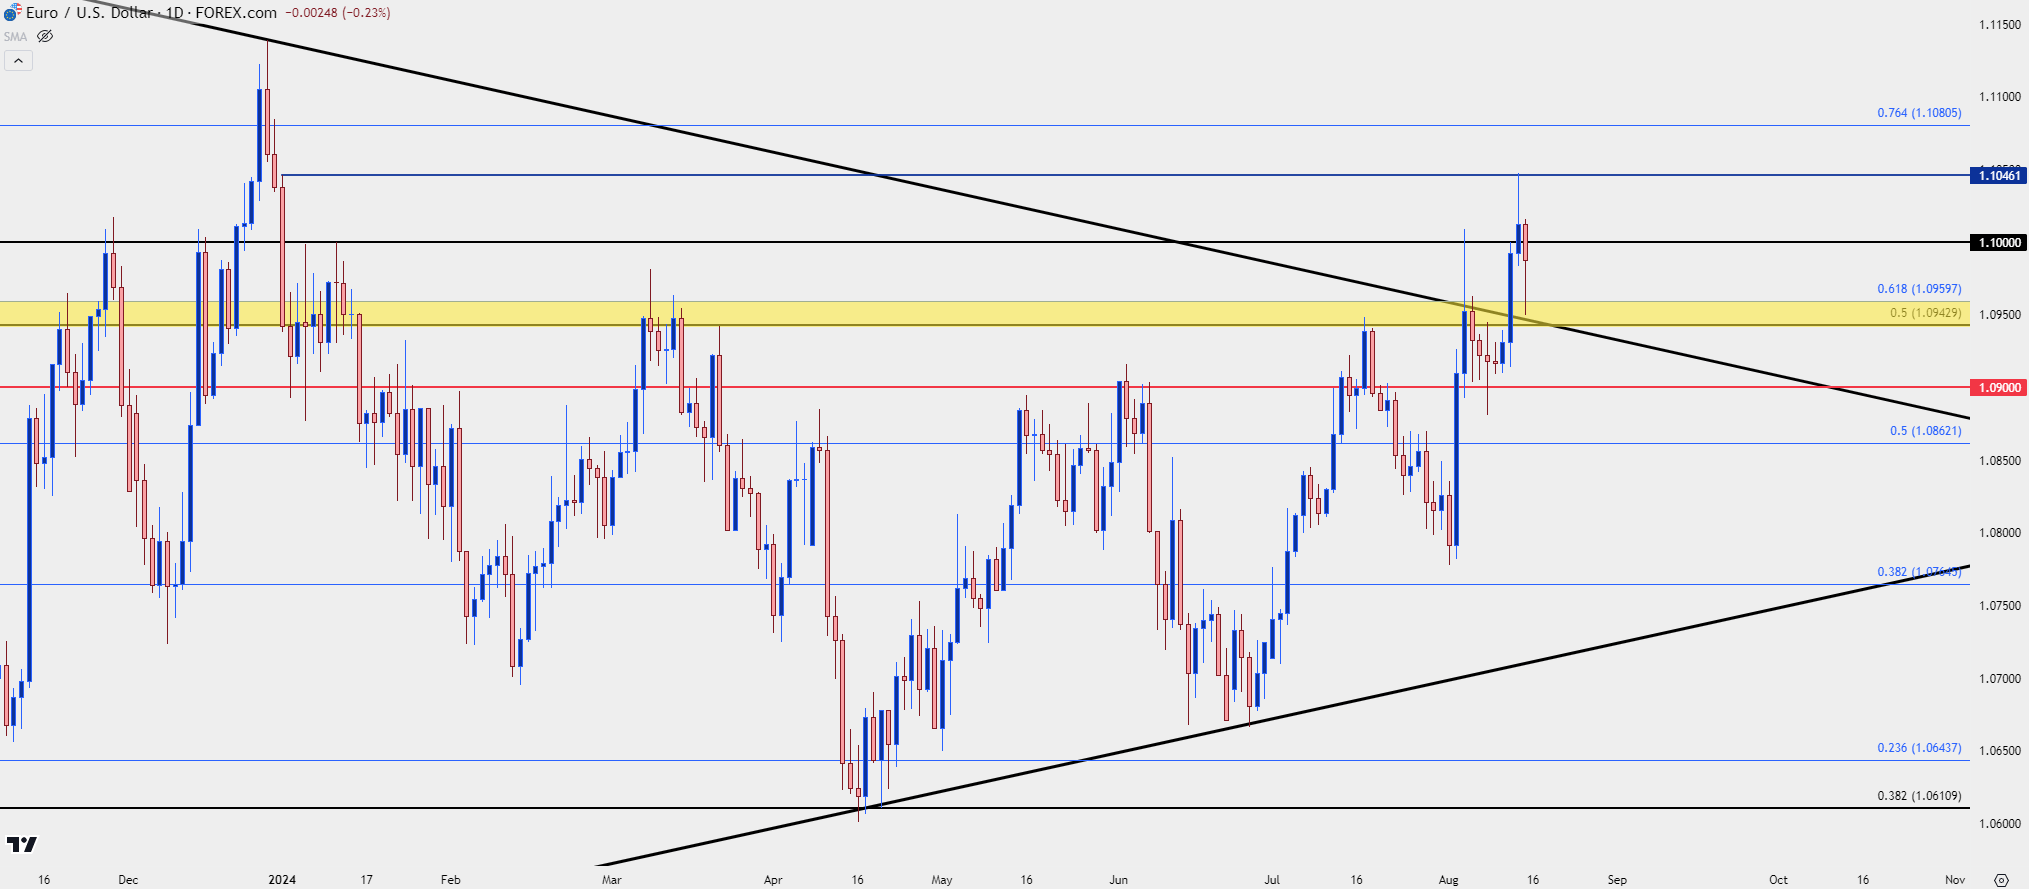
The technical backdrop in EUR/USD remains of interest as yesterday’s push of USD-weakness brought in a fresh 2024 high to the pair. There was little continuation after, however, and a fast pullback arrived with some help from the retail sales print. At this point, that same area of prior resistance, spanning from the Fibonacci level at 1.0943 up to the 1.0960 level have held support, with a possible higher-low after yesterday’s higher-high.
EUR/USD Daily Price Chart
 Chart prepared by James Stanley, EUR/USD on Tradingview
EUR/USD: Does the Breakout Have Staying Power?
For the EUR/USD breakout to extend we would likely need to see continued weakness in the US Dollar, which is possible but as I showed in the Tuesday webinar, there’s context for higher-lows there, and that case has strengthened since the event.
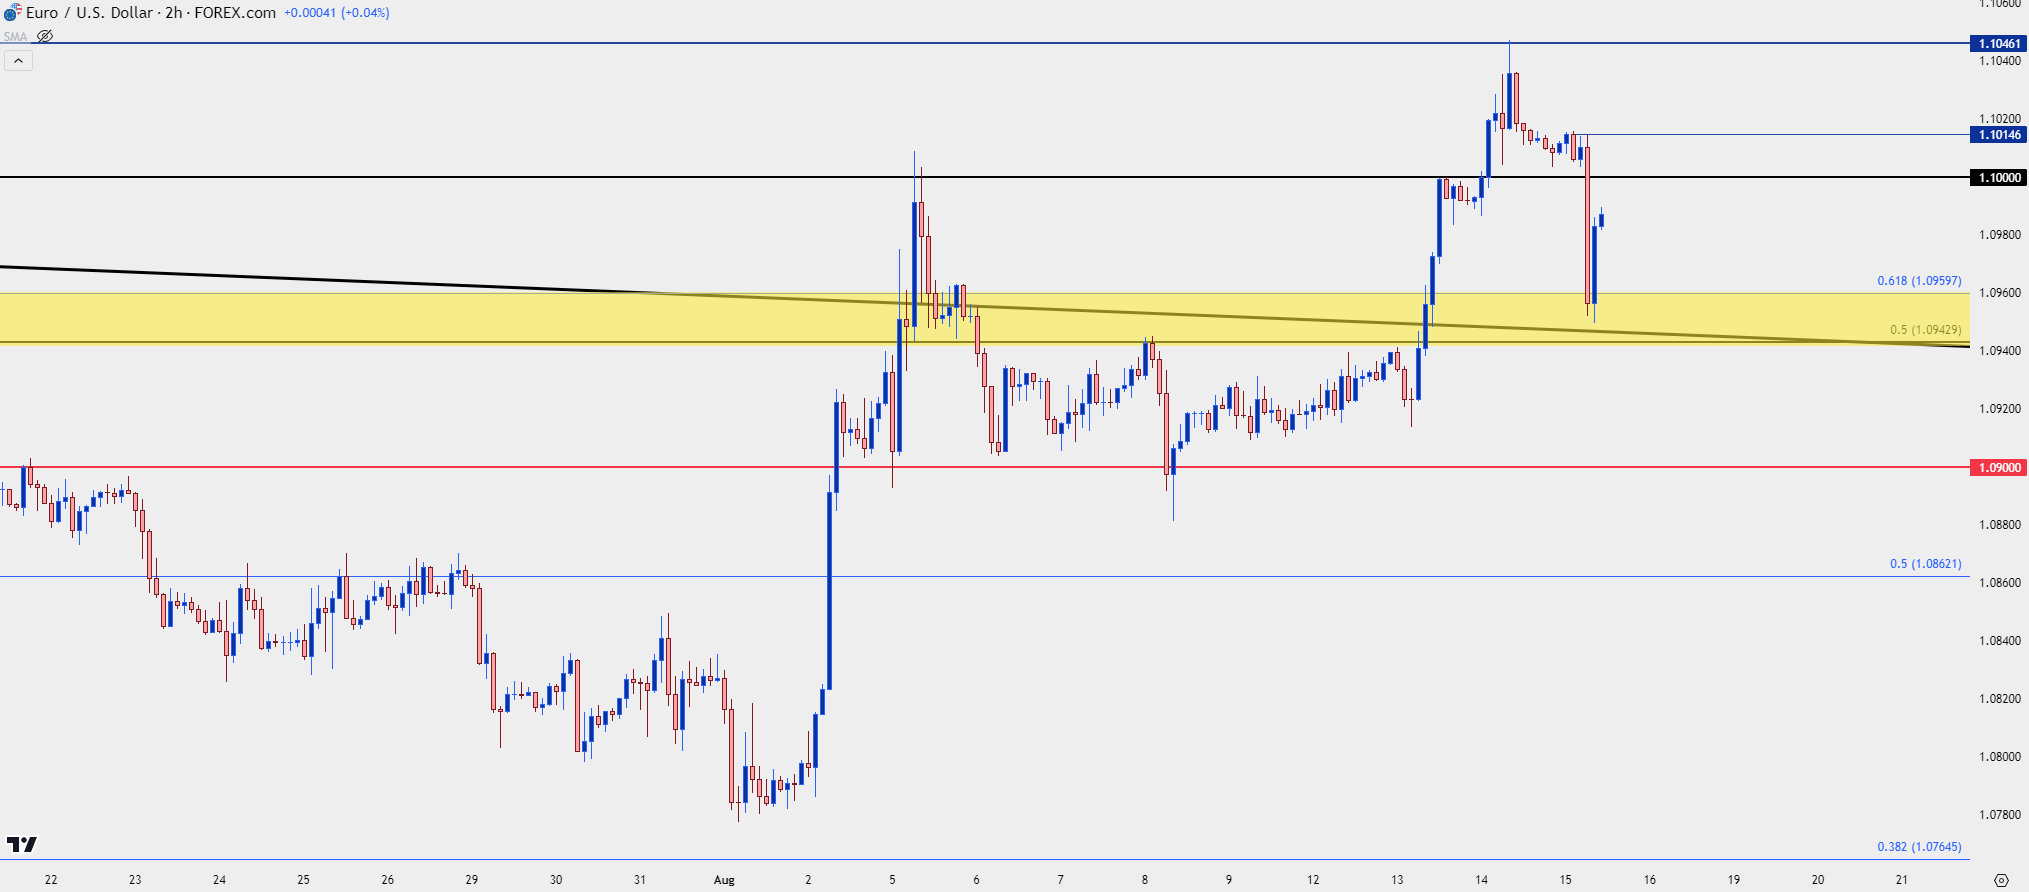
From shorter-term charts, we can see the build of bearish structure as shown by a push down to a fresh lower-low, which can strengthen the case for a deeper pullback if a lower-high can hold. The 1.1000 level presents that type of potential but, realistically, anything inside of 1.1015 can justify a similar case.
EUR/USD Two-Hour Price Chart
 Chart prepared by James Stanley, EUR/USD on Tradingview
EUR/USD: The Bullish Case
In the above chart, we can see a possible opening door for bears. But – what if sellers are unable to hold a lower-high?
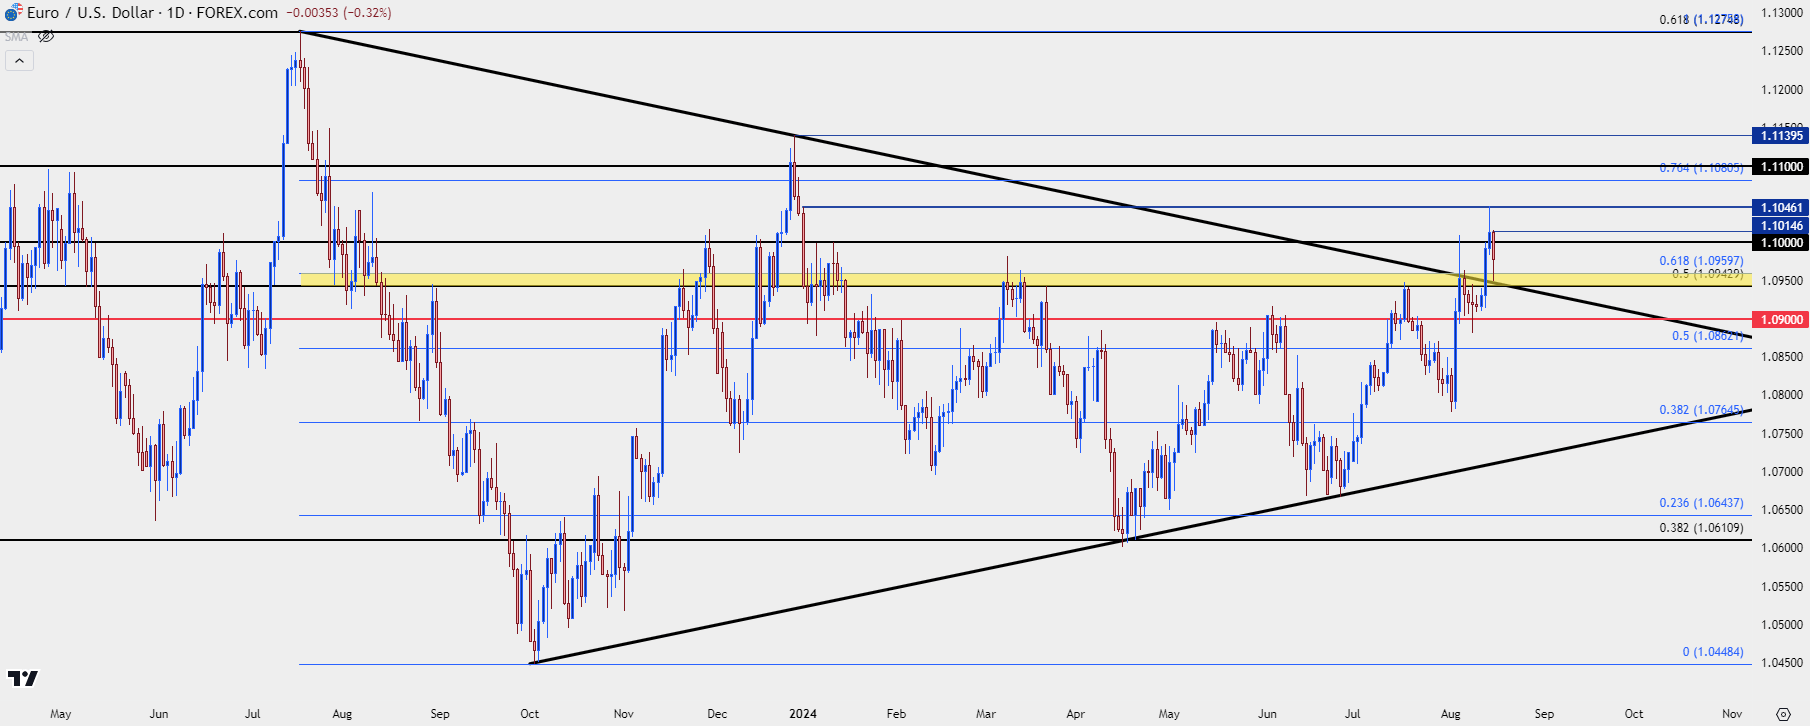
If we go back to the weekly chart, focusing-in on that same zone of 1.0943-1.0960, the argument can be made for this being a higher-low after yesterday’s higher-high. If bulls can take out 1.1015, the door opens for a re-test of that high at 1.1046, after which a Fibonacci level comes into the picture at 1.1081. Beyond that, the 1.1100 price looms large, after which we have the current yearly high at 1.1140.
Above that, recent price action is rather sparse as the fall in July of last year was fast, but the 1.1275 level retains interest as this is the 61.8% Fibonacci retracement of the 2021-2022 major move which held last year’s high.
EUR/USD Daily Price Chart
 Chart prepared by James Stanley, EUR/USD on Tradingview
--- written by James Stanley, Senior Strategist


