Euro, EUR/USD Talking Points:
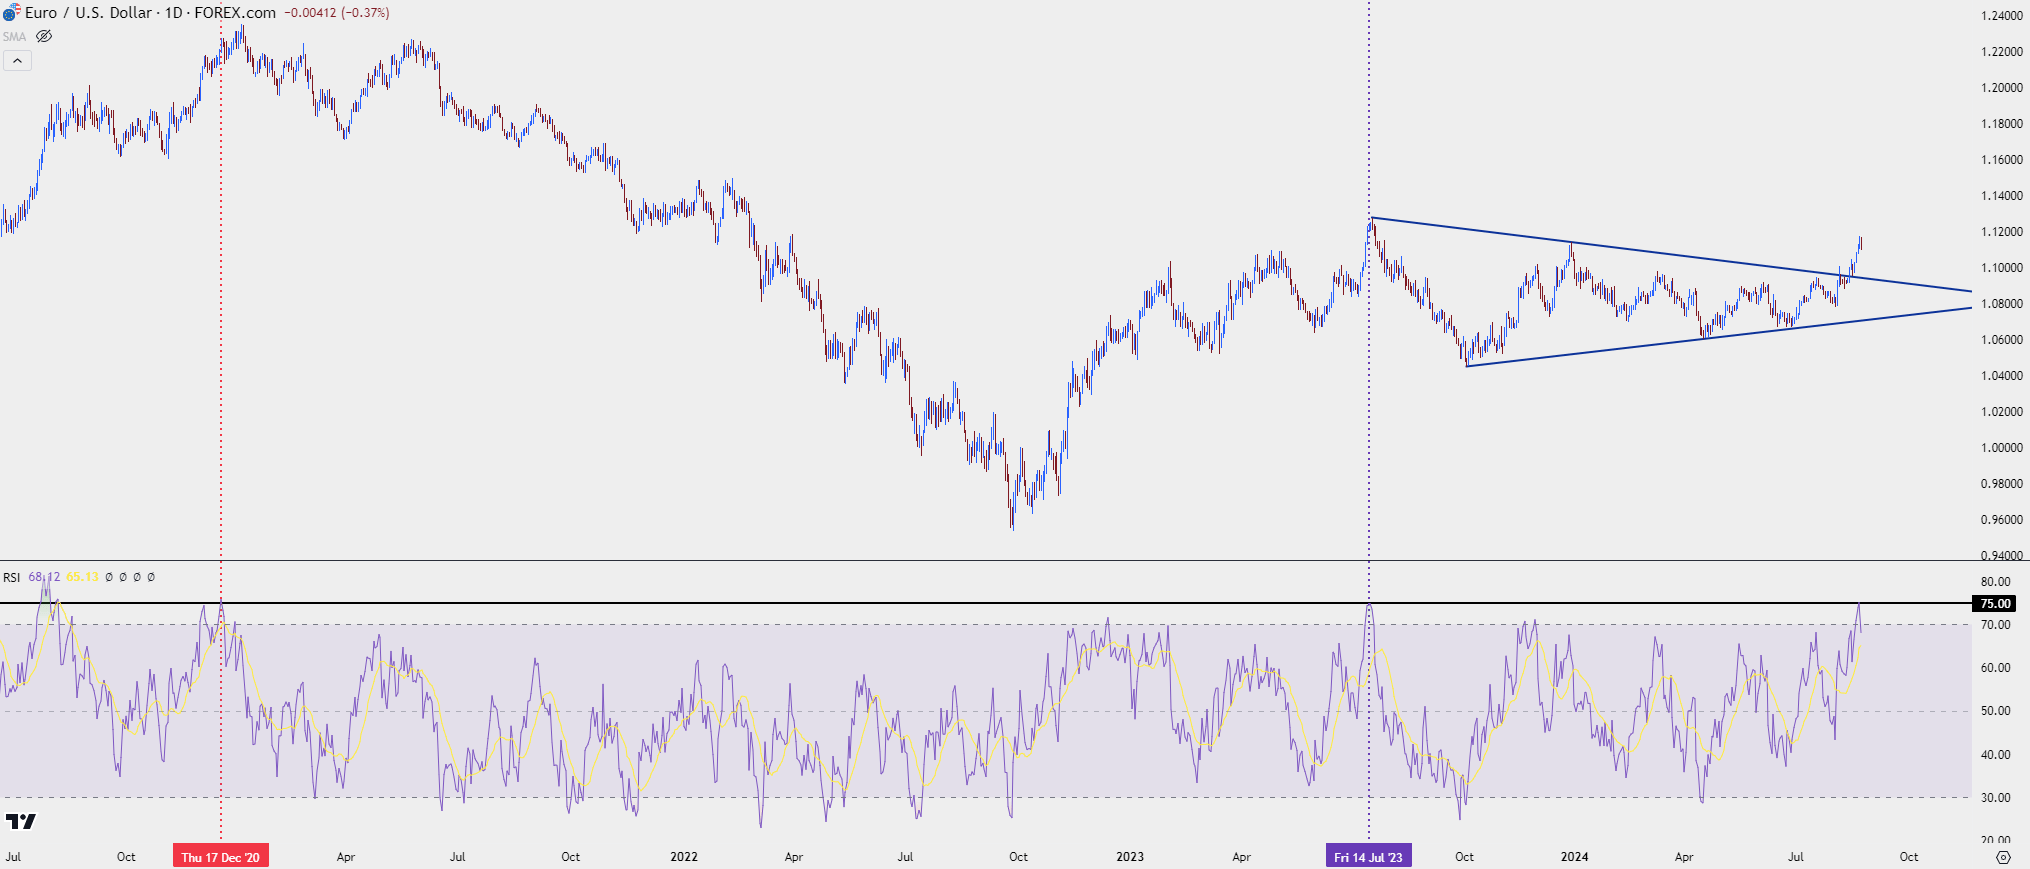
- EUR/USD put in a massive rally from last Thursday’s lows, with daily RSI closing above 75 yesterday which was the first time of such an instance since December of 2020.
- While a sizable pullback showed in early-trade this morning, this story is not yet over as I looked at in the below video.
- I’ll be looking into these setups in the Tuesday webinar and you’re welcome to join, click here for registration information.
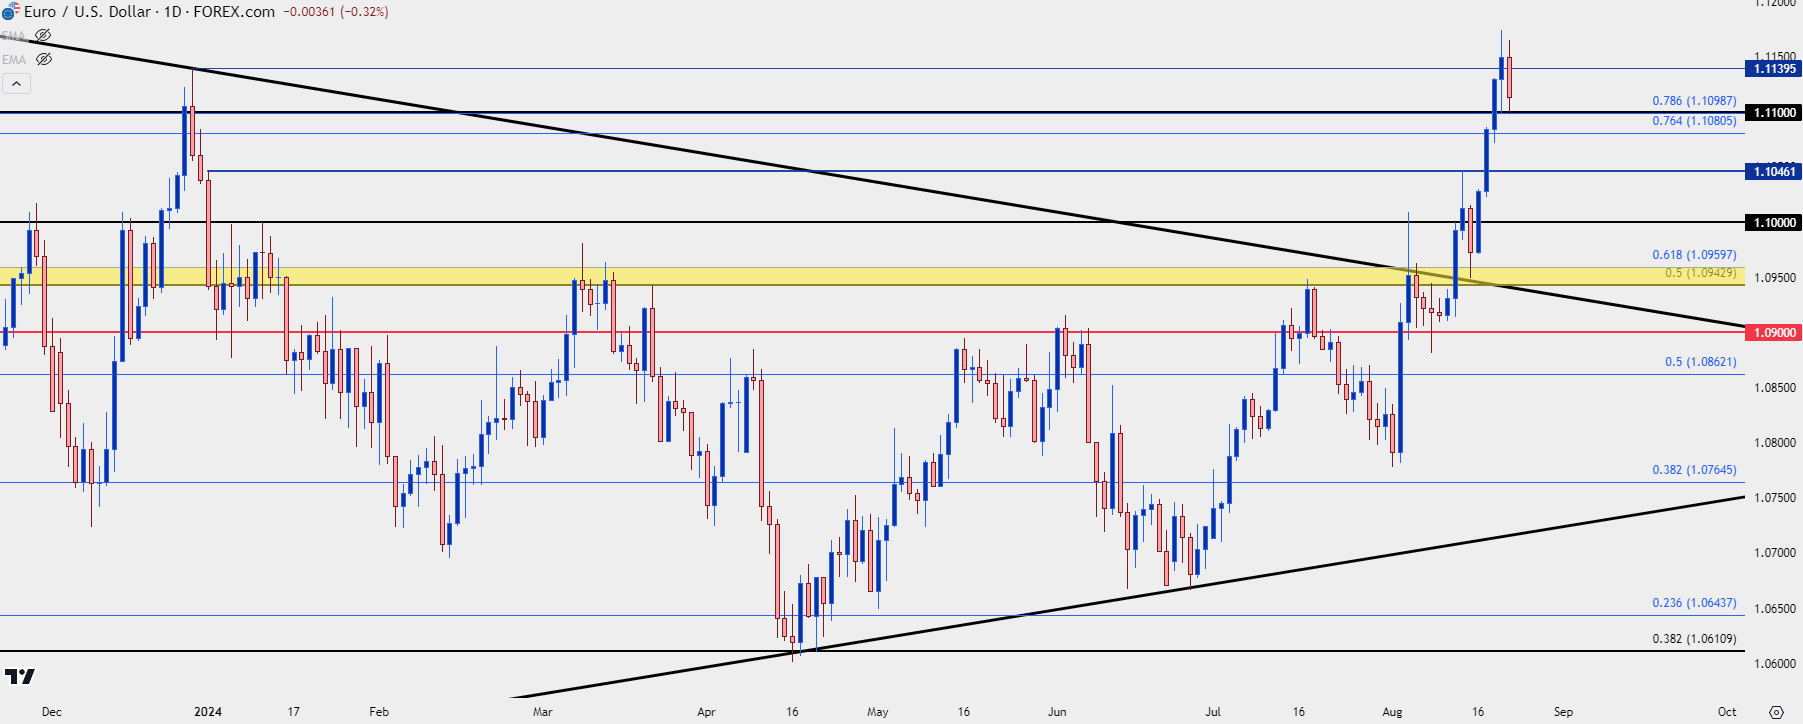
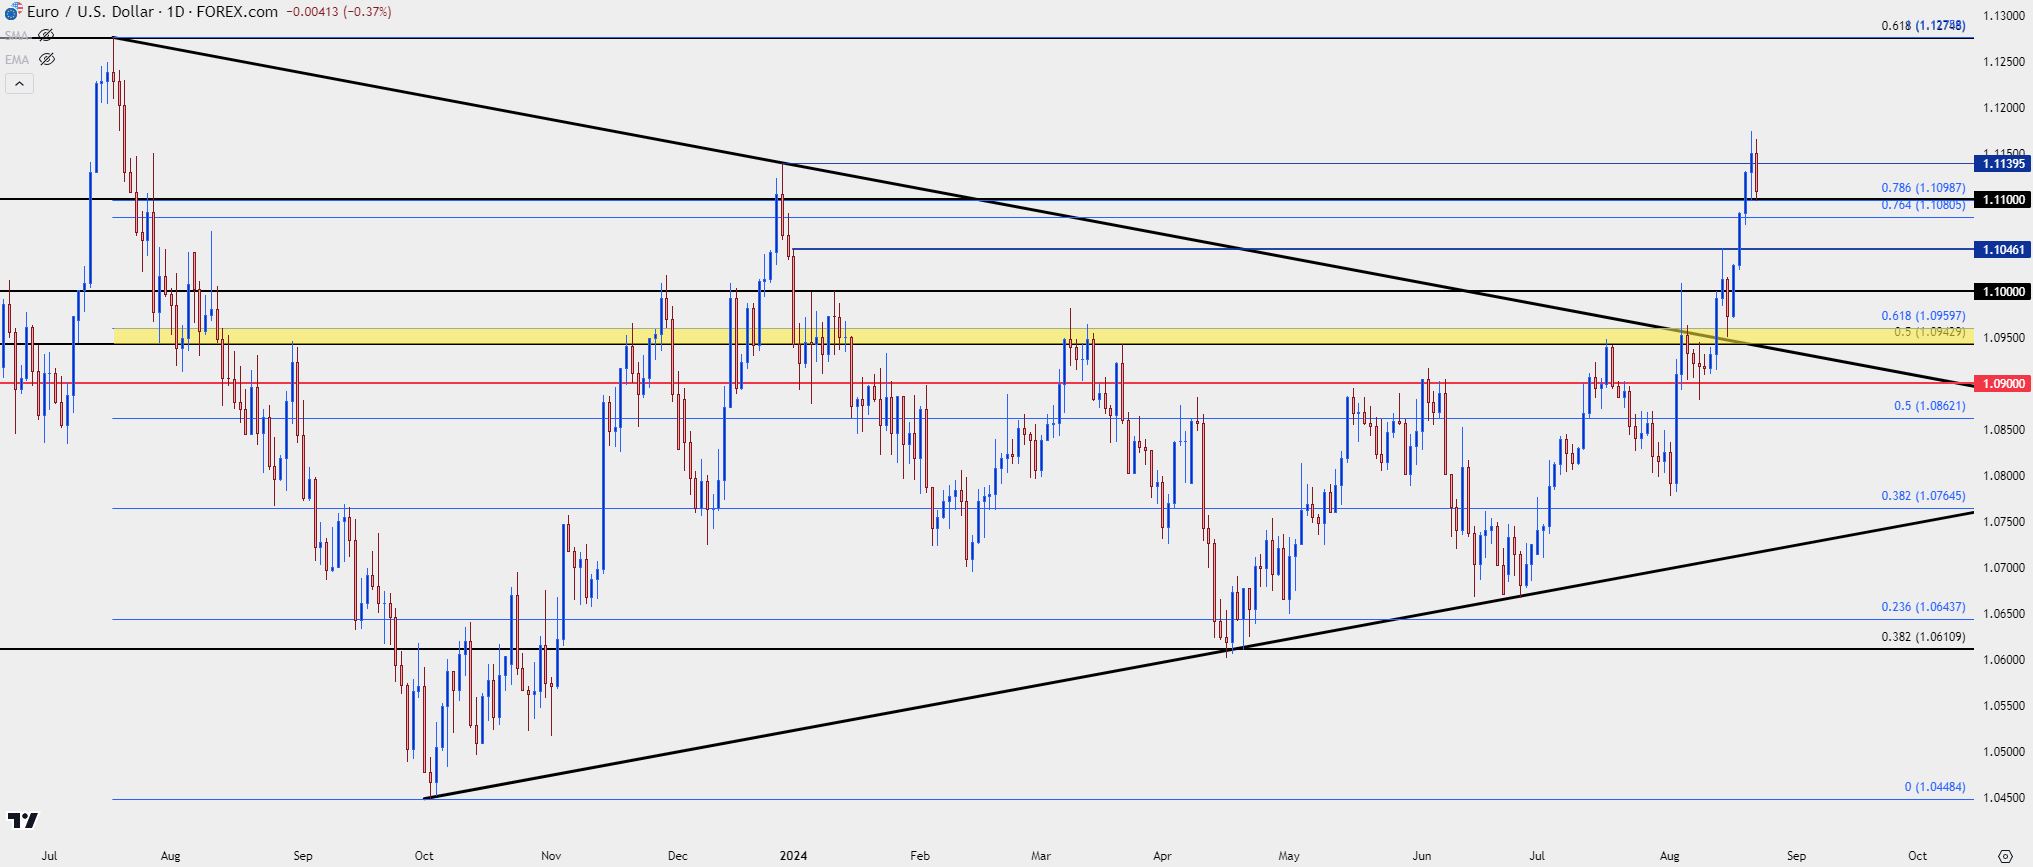
It’s been a brisk backdrop for EUR/USD over the past few weeks. Initially the currency pair tested a breakout from the symmetrical triangle formation in early-August. That triangle had been building for more than a year as prices coiled tighter and tighter. The initial breakout attempt hit right as panic had peaked with VIX at its third highest reading ever, which was right around when stocks had started to rally off their lows.
The bullish move after began to show around last week’s open, with a quick higher-high posting before a pullback into a higher-low. That higher-low printed right at the prior resistance trendline that had made up the topside of the triangle and that gave bulls another push up to another higher-high during yesterday’s trade, which also marked a fresh yearly high for EUR/USD.
EUR/USD Daily Price Chart
 Chart prepared by James Stanley, EUR/USD on Tradingview
Taking a step back to put the move in context, and we can see where a daily RSI reading over 75 is or has been somewhat rare. The last time we had that was back in December of 2020, about two weeks before the pair had topped. Of course, 2021 is when US inflation started to push higher and markets began to bid the USD in anticipation of an eventual tightening campaign from the FOMC, which arrived in 2022 and further drove the bearish trend in EUR/USD.
When the pair topped last year, RSI was close as the highest read then was 74.87. It’s important to note that RSI is not great as a timing indicator, but it does illustrate context quite well which, in this case, indicates that the bullish trend has already been well priced-in.
EUR/USD Daily Price Chart with RSI
 Chart prepared by James Stanley, EUR/USD on Tradingview
EUR/USD Shorter-Term
At this point I think we should still assume bullish control given the pace of the prior rally. But given that overbought backdrop looked at above, it can change quickly.
I’m taking a closer look at the daily chart below to illustrate some levels of importance. As of this writing, the 1.1100 level has helped to hold the lows for today so far, and there’s also context for support potential at 1.1081 and 1.1046. After that, the major psychological level of 1.1000 is back in the picture and notably this level has not yet been tested for support since the bullish breakout two weeks ago.
For bearish scenarios, a lower-high on a shorter-term basis can begin to open the door for such. In the video linked above I had highlighted the 1.1140 level as a spot of interest for such. Alternatively, a push down to a lower low, such as the 1.1046 level or perhaps even the 1.1000 level, could open the door for a lower-high to post at a prior point of support.
EUR/USD Daily Price Chart
 Chart prepared by James Stanley, EUR/USD on Tradingview
--- written by James Stanley, Senior Strategist


