Euro Technical Analysis Talking Points:
- EUR/USD has broken out to a fresh monthly high after the release of US CPI data, but EUR/JPY has shown a sizable pullback as Yen-pairs saw a quick rush of JPY strength on the back of this morning’s data.
- At this point EUR/JPY has pulled back for a support test at prior resistance of 171.62. There’s been accusations of BoJ intervention, but regardless of the ‘why,’ the matter of importance now is whether buyers line up to defend that support in the direction of the carry, or whether longer-term carry traders unwind positions in anticipation of further losses in the pair.
- I’ll be discussing these themes in-depth in the weekly webinar. It’s free for all to register: Click here to register.
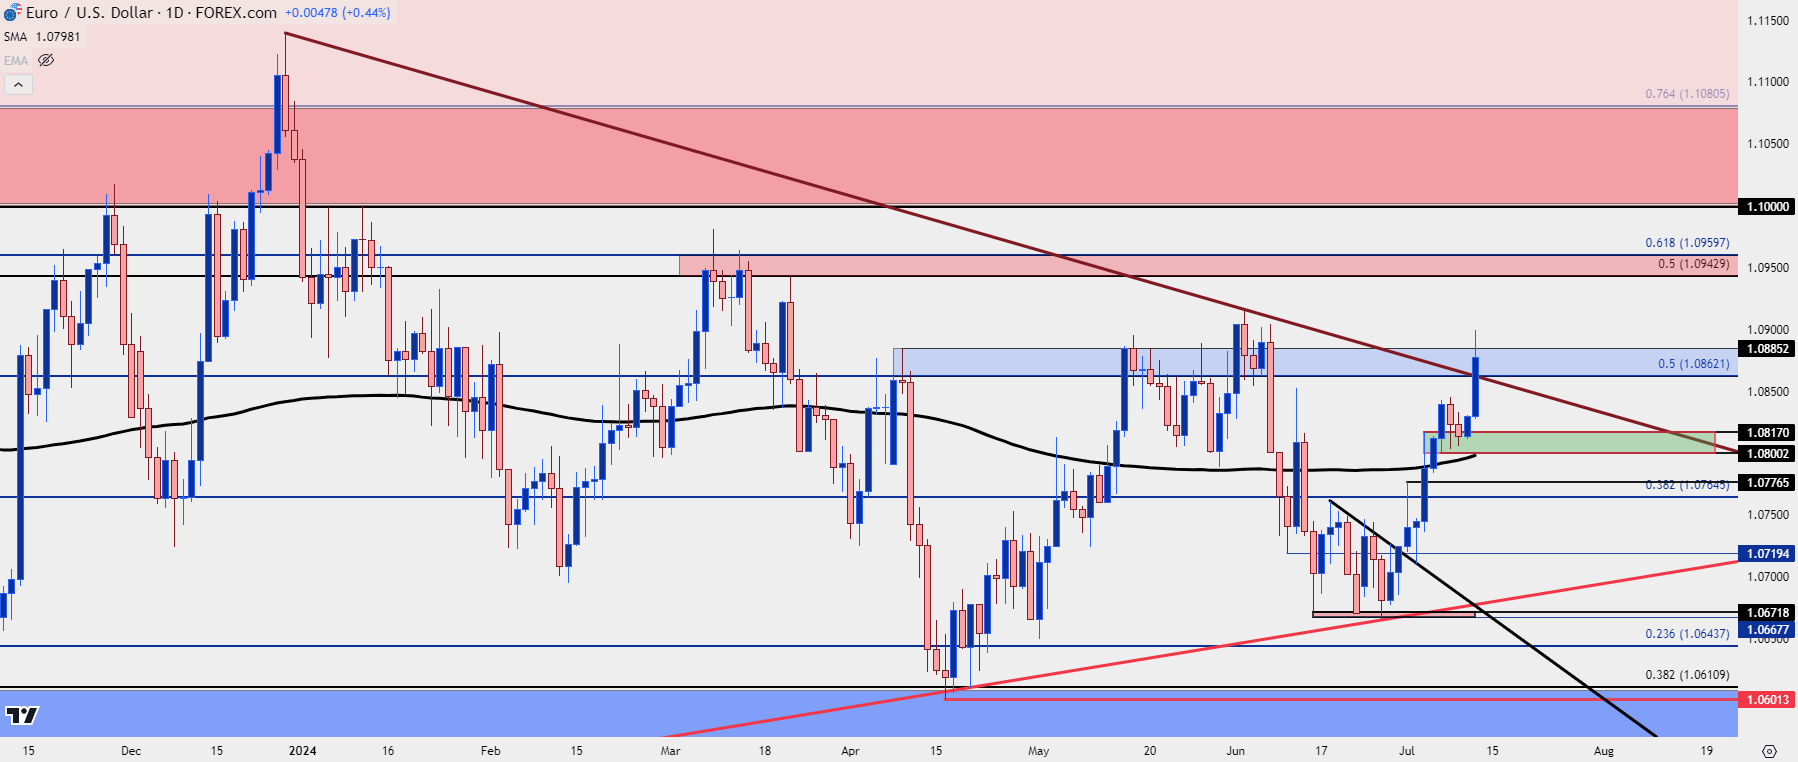
Euro strength has continued against the US Dollar, with this morning showing another boost to the pair. EUR/USD has set a fresh monthly high while testing above the trendline taken from last December’s swing high.
I had looked into this on Monday with an accompanying video, when EUR/USD was in the midst of a support test at prior resistance. I was highlighting the resistance zone inside of the 1.0900 handle which has been tested already, and there’s deeper resistance around the 1.0943 Fibonacci level that’s related to both 1.1276 (last year’s high) and 1.0611 (this year’s low). That price of 1.0943 was last in-play in March, helping to set resistance before bears took their shot, ultimately pushing down to 1.0611, shown in a purple box below.
EUR/USD Weekly Price Chart
 Chart prepared by James Stanley, EUR/USD on Tradingview
EUR/USD Daily
From the daily chart, we can get a clear view of that sequence of higher-highs and lows that the pair’s been showing so far in the first couple weeks of Q3 trade. I had looked into this ahead of the Q3 open, as EUR/USD had started to stall above the previously-established 2024 swing-low; and so far in the fresh quarter, bulls have been driving.
In the Tuesday webinar, I looked at the higher-low support test that was showing at prior resistance, and that’s since led to another higher-high as EUR/USD is now testing above the trendline taken from last December and this June’s swing highs.
This illustrates bulls’ control, and this opens the door for the next resistance zone overhead, spanning from Fibonacci levels at 1.0943 and 1.0960. This was the zone that held two weeks of grind at the end of Q1 before bears took over, ultimately pushing down to support at the 1.0611 Fibonacci level.
EUR/USD Daily Price Chart
 Chart prepared by James Stanley, EUR/USD on Tradingview
EUR/JPY
While the CPI print in the US has gotten a lot of attention already this morning, it’s the rumor of Japanese intervention that’s probably been more noteworthy.
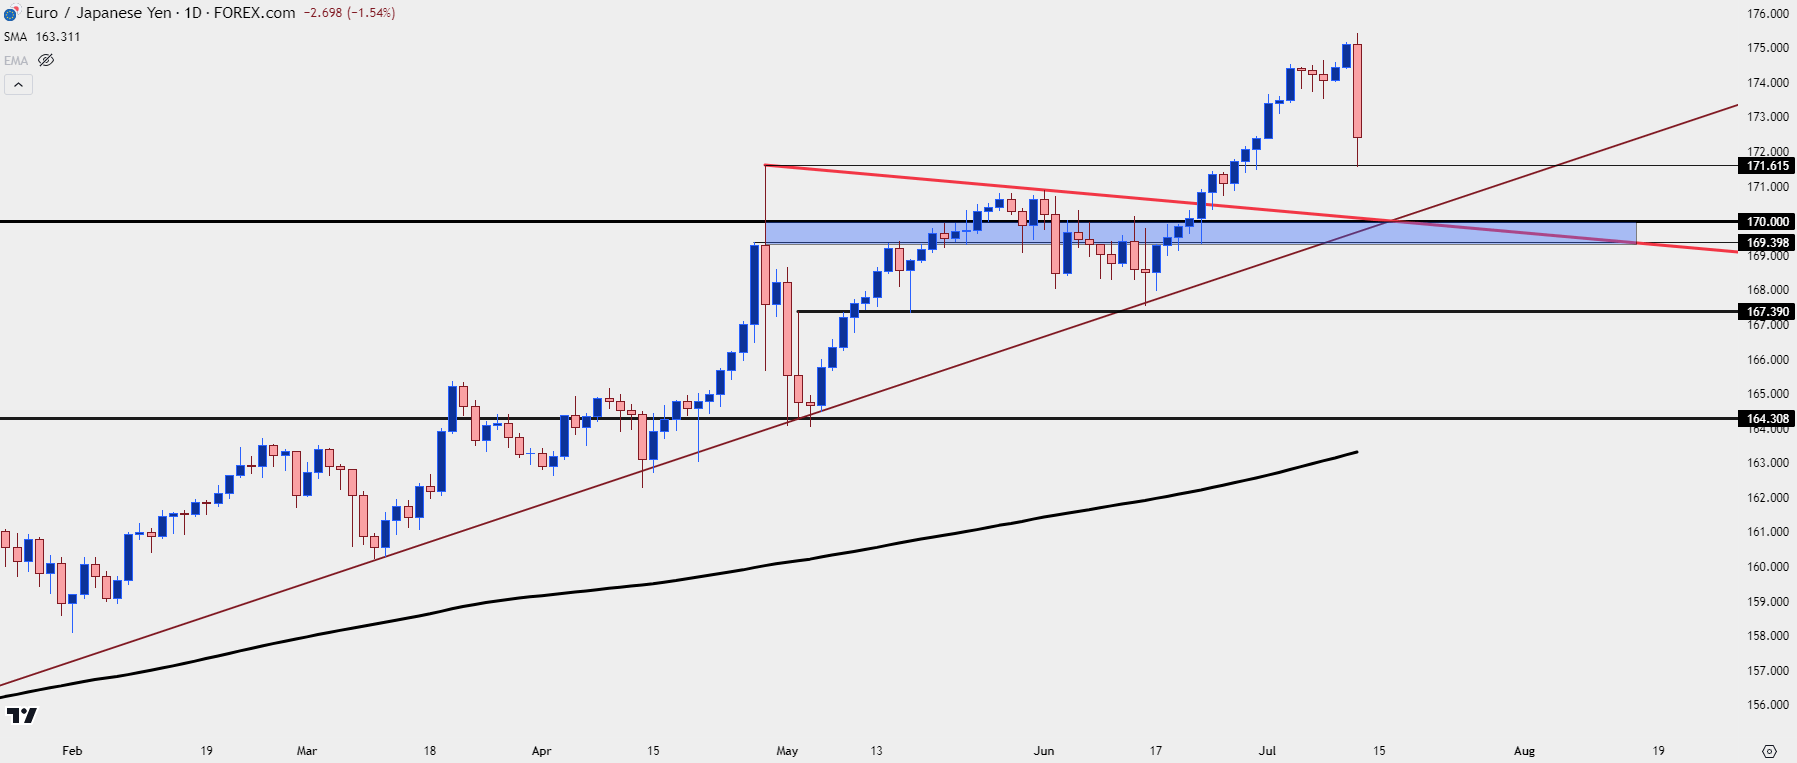
Yen-pairs snapped back aggressively after the CPI release and USD/JPY is currently trading below the 160.00 handle. In EUR/JPY, however, that snap back has so far found support at a big spot on the chart – the same that had set the highs in April before the BoJ intervention after USD/JPY had scaled above 160.00.
EUR/JPY Daily Price Chart
 Chart prepared by James Stanley, EUR/JPY on Tradingview
The peak-to-trough move in the pair has so far been 386.2 pips from today’s high down to today’s low. The carry remains decisively-tilted to the long side of the pair and this provides some incentive on both sides of the move. Longs can earn rollover while shorts are forced to pay given the continued rate divergence between the underlying economies.
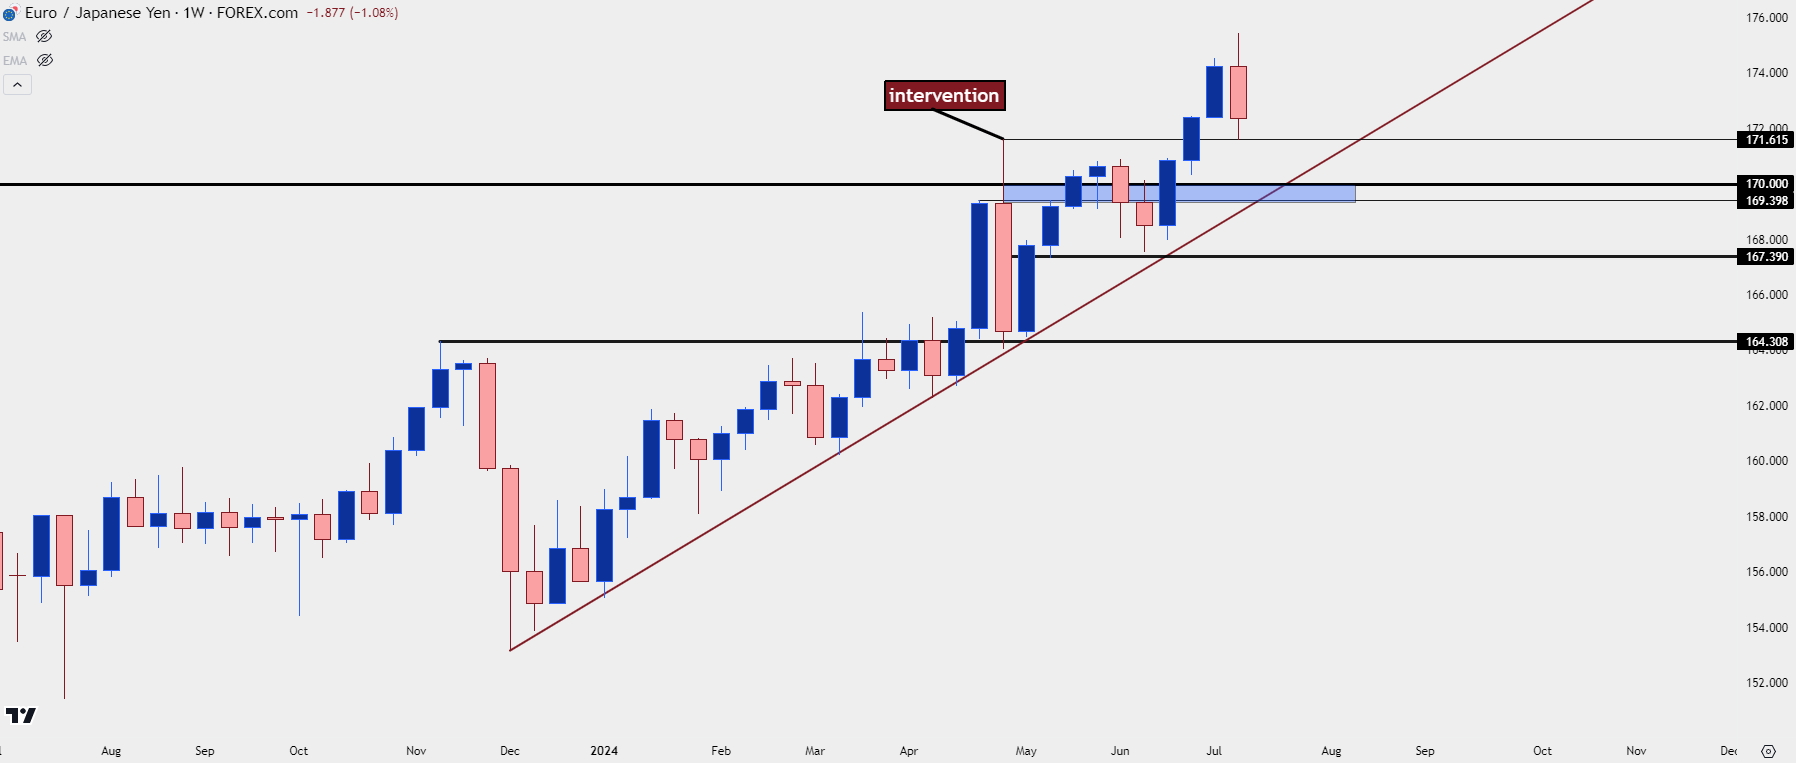
But, like we saw from the April/May episode, intervention is not a panacea. In that instance, we saw a single week of weakness in the pair, only for bulls to load the boat on the long side of the carry, and continue the trend up to fresh highs.
EUR/JPY Weekly Price Chart
 Chart prepared by James Stanley, EUR/JPY on Tradingview
EUR/JPY Shorter-Term
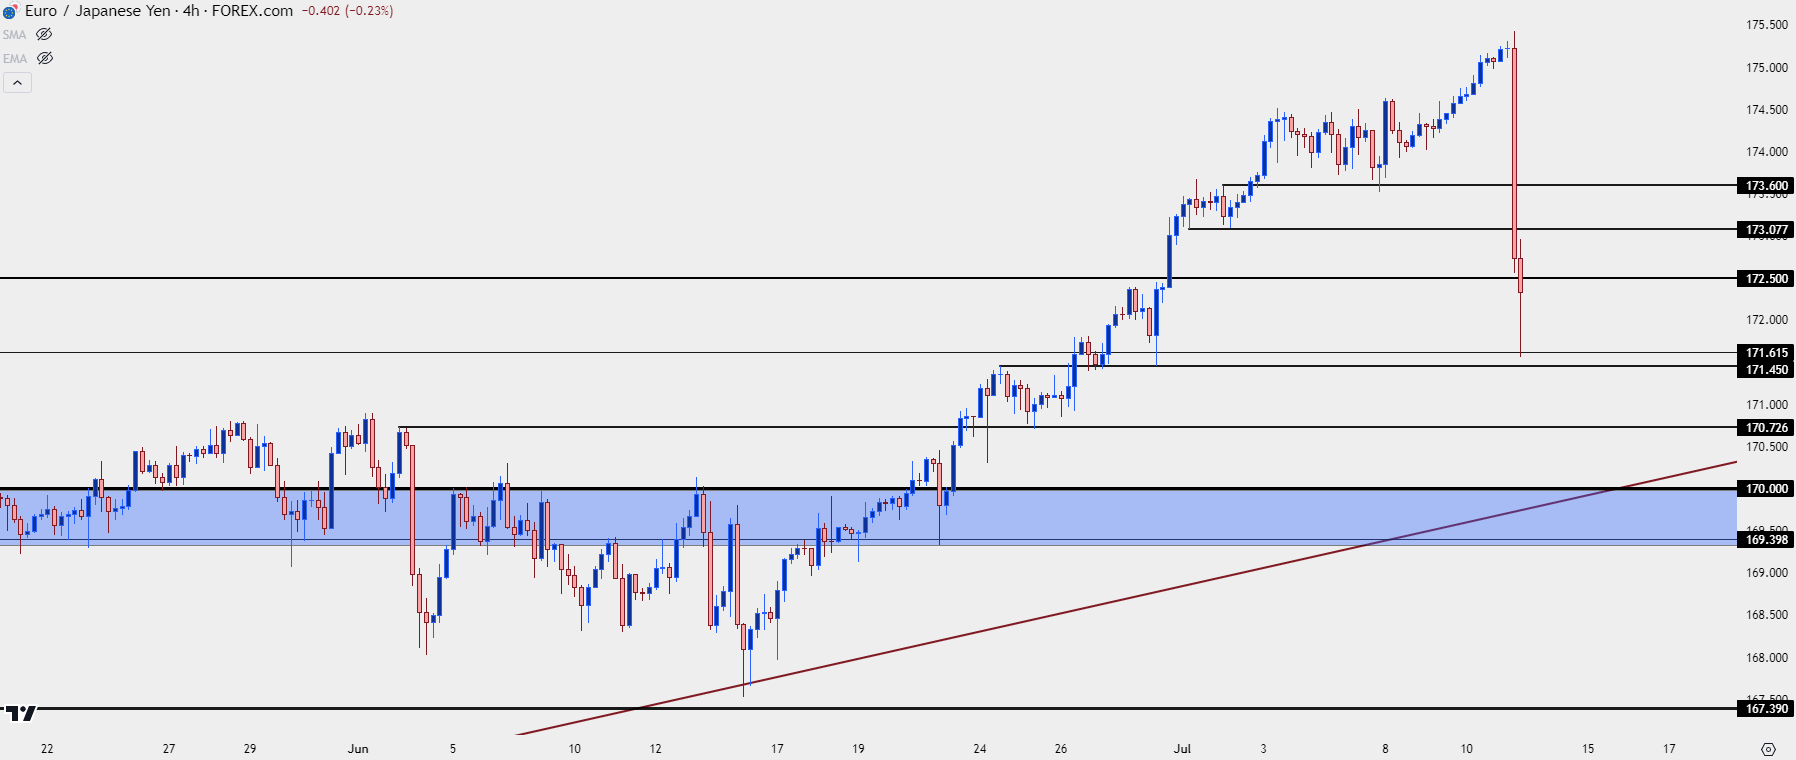
The big question now is how frightened carry traders are of further losses, and whether any subsequent bounces bring on selling pressure from bulls growing increasingly worried of a reversal scenario in the pair. At this point, there’s been a strong bounce from that prior resistance at 171.62, but bulls haven’t been able to hold above the psychological level at 172.50, and that remains a key price on the chart.
A bit higher, there’s prior price action swings at 173.08 and 173.60, both of which become points of emphasis for possible lower-high resistance. If bulls are able to break through, that’s further indication that there’s less worry of a broader-based sell-off which can keep topside strategies as attractive.
If, however, bulls fail to hold the low, the 170.00 level is of interest for longer-term support potential. Between current price and that zone, there’s also a prior swing at 170.73 that remains of interest.
EUR/JPY Four-Hour Price Chart
 Chart prepared by James Stanley, EUR/JPY on Tradingview
--- written by James Stanley, Senior Strategist


