Euro, EUR/USD, EUR/JPY Talking Points:
- EUR/USD held last week’s high at the 1.0943 Fibonacci level after which sellers pushed price back-below the 200-day moving average.
- EUR/JPY similarly pulled back late last week but, so far, has held support at prior resistance.
- I’ll be discussing these themes in-depth in the weekly webinar. It’s free for all to register: Click here to register.
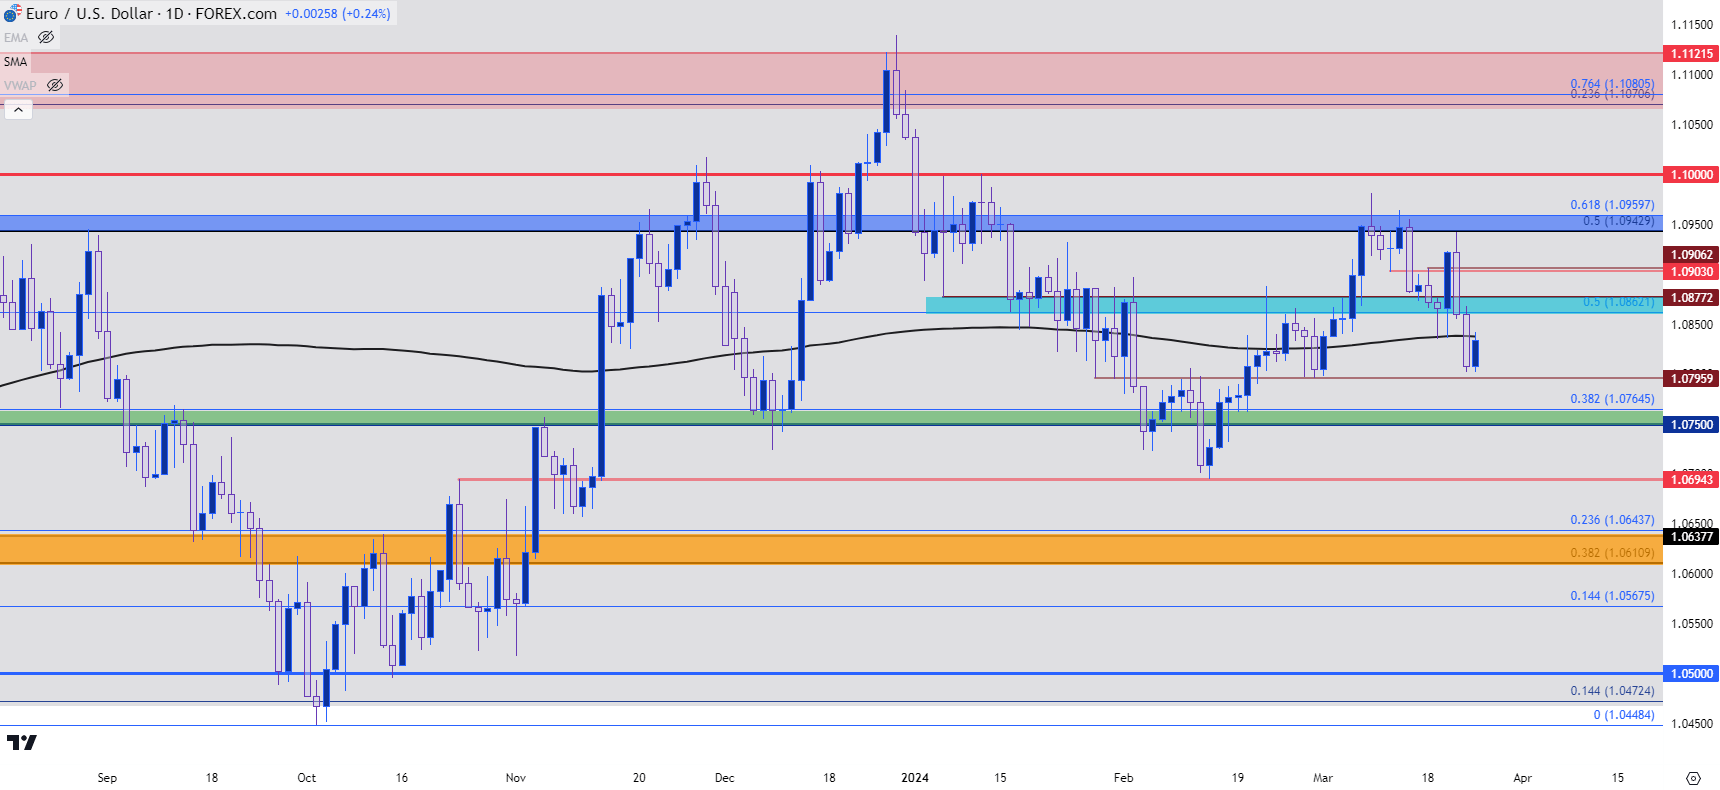
EUR/USD remains near the middle of a range that’s now been in-place for more than 15 months. As equities have fired higher for much of this period and Bitcoin and Gold have come back to life, the U.S. Dollar has been seemingly unable to hold on to any long-term trends, and that gyration in DXY has allowed for a similar show of mean reversion in EUR/USD.
That’s not to say that there hasn’t been shorter-term volatility to work with, and this was on display last week. The Fed sounded very dovish on Wednesday and that led to a quick run of USD-weakness. But DXY found support at the same resistance that was in-play a week earlier, and that led to a strong push of strength in the final two days of last week. So far this week, that theme has been pulling back, and this is relevant to EUR/USD, as well.
Last week’s high for EUR/USD held at the 1.0943 Fibonacci level. That’s the 50% mark of the 2021-2022 major move and I have this connected to the 1.0960 level on the below chart to create a zone that’s been frequented quite a bit over the past year-and-change. That resistance hit led to a push down towards the 1.0800 handle, and so far, today’s bounce from that support is finding resistance at the 200-day moving average, which had previously helped to set support last Tuesday and Wednesday ahead of the FOMC rate decision.
EUR/USD Daily Price Chart

Chart prepared by James Stanley, EUR/USD on Tradingview
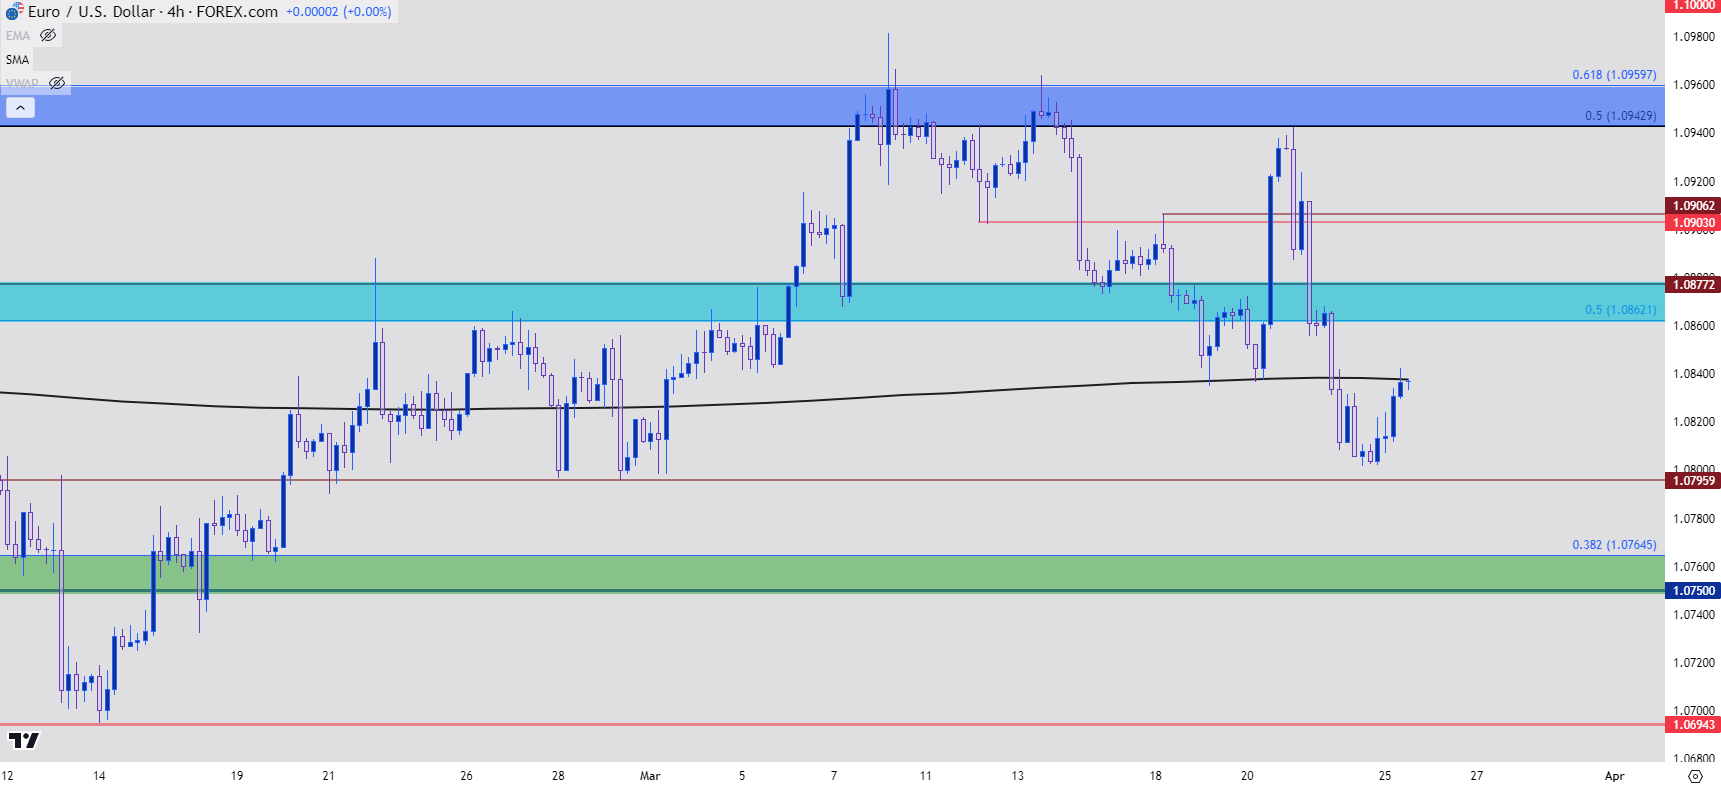
On the four-hour chart below, we can gain some additional respect for that resistance zone spanning from 1.0943-1.0960. It came back into play on the morning of NFP Friday, helping to hold the highs at that point and then last week, just ahead of the FOMC rate decision, there were two tests of support at the 200-dma, which led to another bounce up to the resistance zone.
But now that sellers have wrestled back control, the big question is whether they can keep it long enough to allow for that longer-term range to fill-in on the downside. As you can see from the chart below, there’s a current resistance test taking place at the 200-dma. But a bit higher is another zone of interest spanning from 1.0862-1.0877.
EUR/USD Four-Hour Price Chart
 Chart prepared by James Stanley, EUR/USD on Tradingview
EUR/JPY
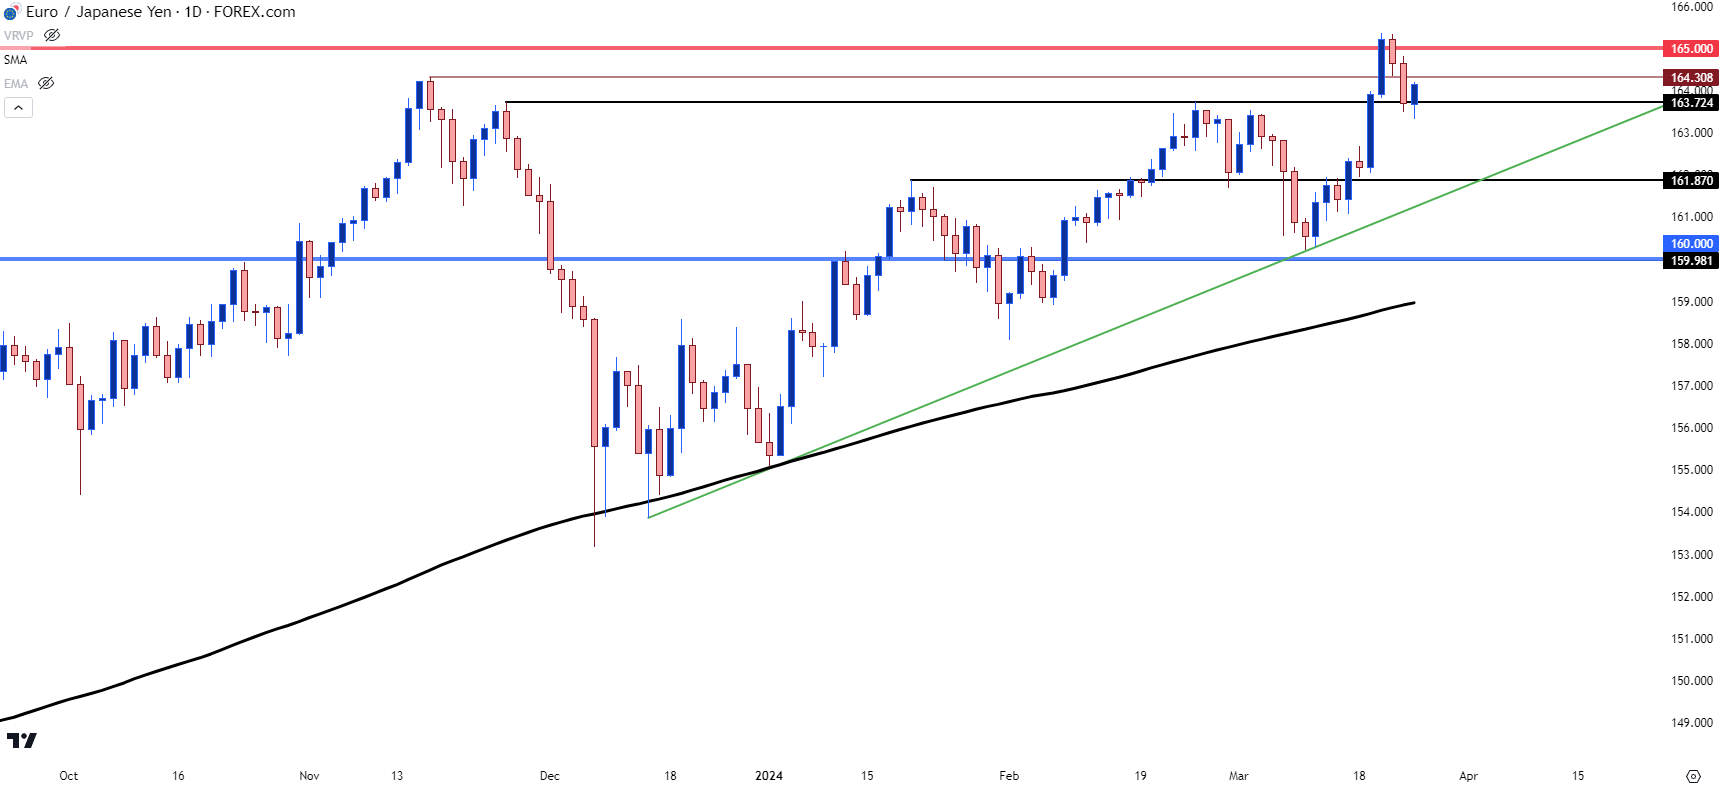
While EUR/USD has been range-bound for the past year-plus, EUR/JPY has spent much of that time in the grip of a trending environment. Just last week, after the BoJ rate hike and the dovish FOMC meeting, EUR/JPY set yet another fresh 15-year high, testing above the 165.00 level for the first time since 2008. But, as USD pulled back on Thursday and Friday, so did EUR/JPY, pushing back for a re-test of support at a prior swing-low turned swing-high plotted at 163.72. So far, that’s remained defended in early trade this week.
EUR/JPY Daily Price Chart
 Chart prepared by James Stanley, EUR/JPY on Tradingview
EUR/JPY Scenarios
Given the Yen’s response to last week’s rate hike from the BoJ, the next question is whether there’s an intervention in the near-future. So far over the past two years, it was the 152.00 level in USD/JPY that’s caught the attention of the Finance Ministry, and already we’ve heard comments regarding currency weakness. To kick off this week, Japanese Vice Finance Minister, Masata Kanda, said that current JPY weakness did not reflect fundamentals, was driven by speculative activity, and they stand ready to respond to the Yen’s moves.
This isn’t really anything new as we had similarly heard the verbal warnings of intervention last year when the USD/JPY pair was pushing towards the 152.00 level; but with the USD reversing in Q4, matters soon settled. But now that the pair is back in that zone the question remains as to their tolerance for intervention.
The question that I posed in this week’s JPY forecast was, given that the BoJ has hiked rates and the response from markets was even more Yen-weakness, might this compel the Finance Ministry to take a step back from defending the 152.00 level? As I had highlighted in the USD/JPY chart in that article, there’s a long-term ascending triangle formation in-play, and the frequency of tests at 150-152 has continued to increase. That backdrop is something that’s normally bullish in nature.
And for the BoJ, intervention isn’t necessarily a ‘great’ move, as they have to use finite capital reserves to essentially trade the opposite of what their own monetary policy is encouraging. Those trades can fast go sideways, particularly if market participants continue to push the theme of Yen-weakness, which they have of late.
This could be somewhat like 2022 trade, when USD/JPY had stalled at 145 for a month as warnings of intervention dominated the headlines. Price held that resistance well, but bulls remained active, eventually forcing a push up to the 150 handle after which the Finance Ministry ordered the BoJ to intervene.
But – even that did not kill the trend as it merely pushed bulls back down to support. And that support held into the next month, when a lower-than-expected U.S. CPI print helped to reverse the USD, which pulled USD/JPY along with it in a massive retracement. But, from that episode a couple of different items seem notable. The Finance Ministry seemed to not want to intervene, especially when that 145 level was holding. Also, intervention is not a panacea: Perhaps it can pause a trend or elicit a pullback – but can it force a full-fledged reversal? And for purposes of this article, it seems that USD/JPY is the market that the Finance Ministry is most concerned about; and given that the 2022 intervention took place when both EUR/JPY and GBP/JPY were at much lower levels, this makes sense.
This could keep EUR/JPY as an interesting way to follow continued Yen-weakness. If the Finance Ministry does take a step back from the matter and USD/JPY rises to 155 or higher, then that’s something that could similarly benefit EUR/JPY on the way to fresh 15-year highs. Or – alternatively – if the Euro strengthens against the U.S. Dollar, and USD/JPY holds close to that 152.00 level, that could also keep EUR/JPY in a bullish position as that Euro-strength prices in against JPY.
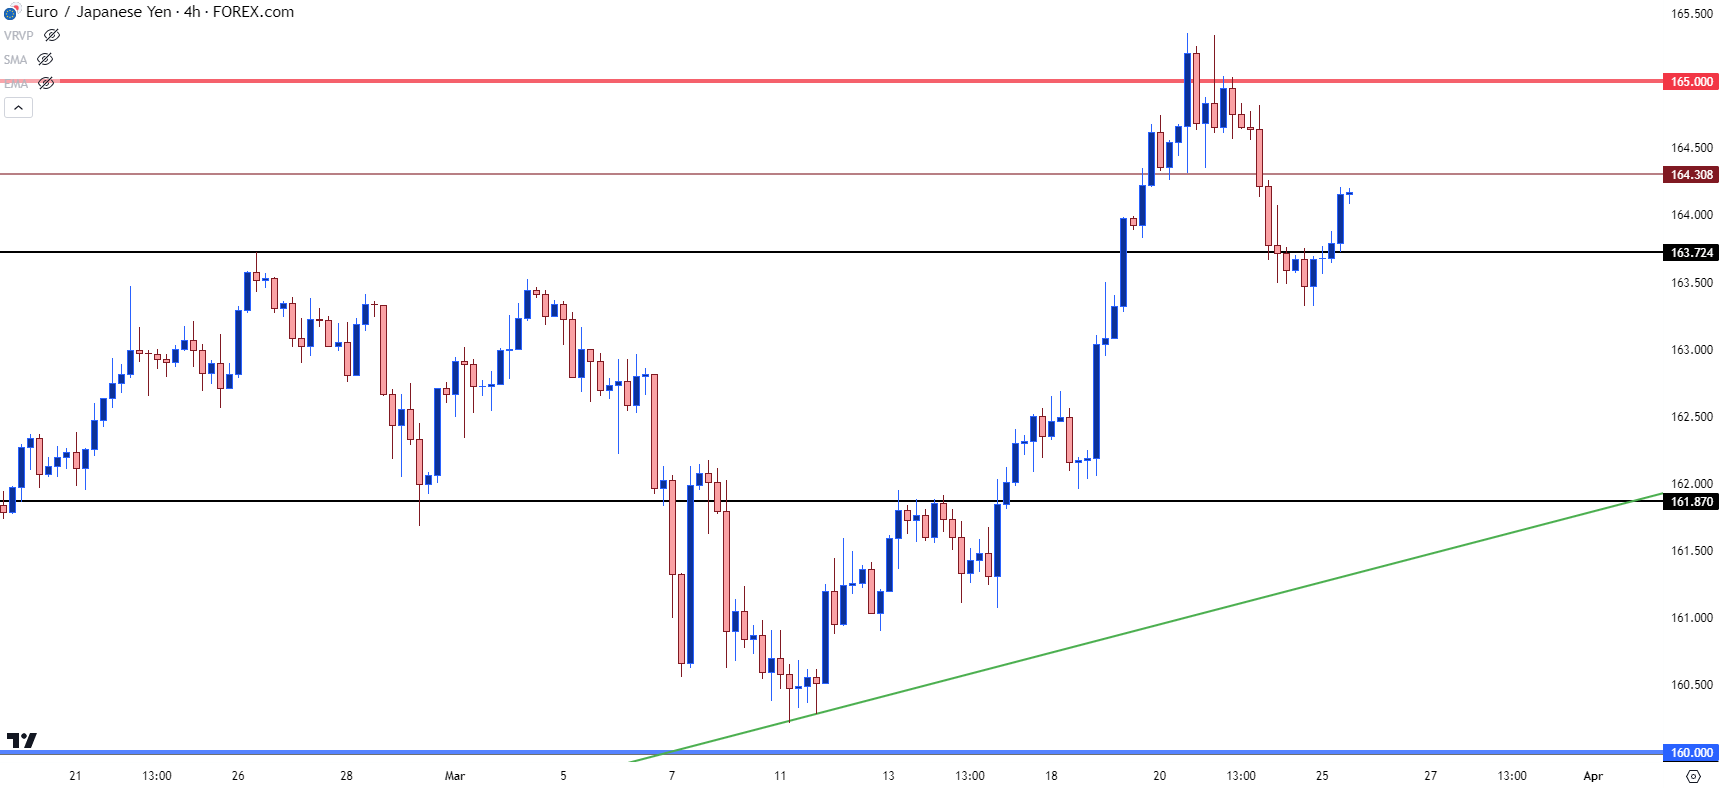
From the four-hour chart below, we can see an important level that may soon be back in the picture. This is the 164.31 swing, what had previously come into play last November when establishing the fresh 15-year high at that point. More recently, it was in as support, helping to hold the lows just ahead of the FOMC rate decision, after which price jumped back up to re-test 165. Bulls were unable to break any new ground that led to the pullback on Thursday and Friday: But if bulls can continue to push, re-claiming support above that level would be key in setting up the next 165 re-test.
EUR/JPY Four-Hour Price Chart
 Chart prepared by James Stanley, EUR/JPY on Tradingview
--- written by James Stanley, Senior Strategist


