Euro Talking Points:
- EUR/USD is starting the week with a pullback after failing to test the 1.1000 handle last week.
- While the ECB talks up the prospect of more rate hikes, it’s US inflation that’s back in the headlines this week with the Wednesday release of CPI data for the month of March. Headline inflation is expected to fall to 5.2% from last month’s 6% print, but core inflation is expected to elevate up to 5.6% from last month’s 5.5% release.
- I’ll be discussing these themes in-depth in the weekly webinar on Tuesday at 1PM ET. It’s free for all to register: Click here to register.
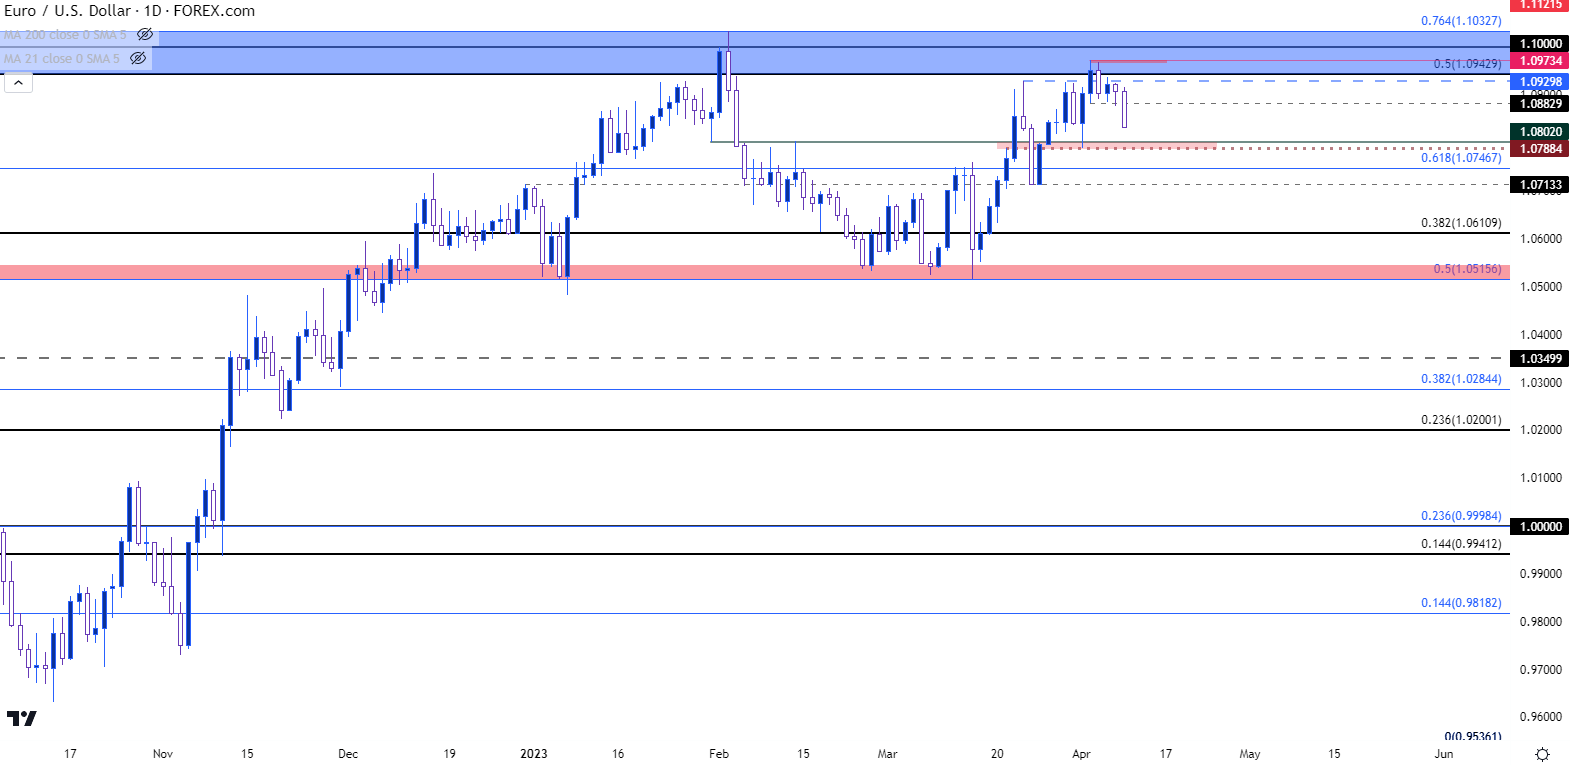
EUR/USD is pulling back to start the week and from the daily chart, the big question is whether bulls have given back control after a failed run at the 1.1000 level last week.
Coming into the Q2 open, EUR/USD had held higher-low support at a key area on the chart before bulls pushed up to resistance at the 1.0943 Fibonacci level. Last Tuesday saw bulls stall, only for bears to move in on Wednesday to hold the high around 1.0973, just inside of the 1.1000 psychological level that traded briefly back in February. Prices held support around the 1.0883 swing into the end of the week, but sellers have already pushed forward to bring a fresh lower-low to the four-hour chart looked at below.
EUR/USD Four-Hour Chart
 Chart prepared by James Stanley, EUR/USD on Tradingview
EUR/USD
The big question at this point is whether EUR/USD bears are going to be able to do anything with the recent lower-high and this morning’s lower-low. Taking a step back to the daily chart and price action for 2023 takes on a very range-bound quality. There’ve been two tests around the 1.0500 level and two tests around the 1.1000 level.
As price nears short-term support around 1.0788-1.0802, there’s deeper support potential around the Fibonacci level at 1.0747 or the swing of 1.0713. Below that, there’s another Fibonacci level at 1.0611 after which that range support around the 1.0500 handle comes back into the picture.
EUR/USD Daily Chart
 Chart prepared by James Stanley, EUR/USD on Tradingview
EUR/USD Longer-Term
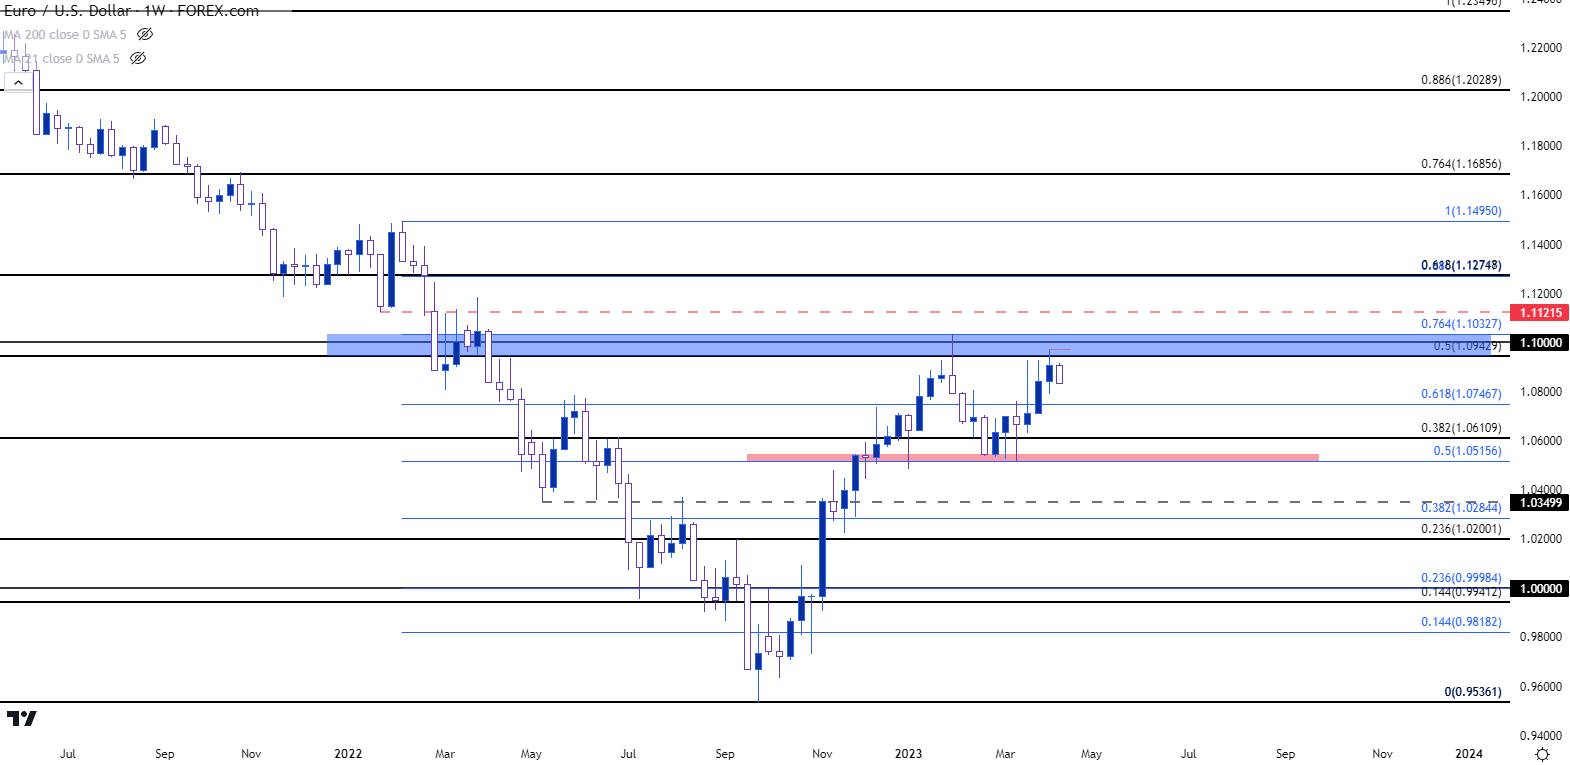
Taking a step back to the weekly chart, and the same zone of resistance that I highlighted two weeks ago remains of issue in the pair. This is the same resistance area that came-in to help build the lower-high last week and it’s the same that helped to lead to the February pullback. And collectively with that support zone around the 1.0500 handle, it marks a range that’s been in-play for the first few months of the year.
The more exciting item is what happens after and there remains potential on both sides of that equation. If bears can elicit a breach of the 1.0500 support zone, there’s deeper support potential around the 1.0350 price swing, after which the 1.0200 Fibonacci level comes into the equation. On the resistance side of the coin, beyond 1.1000, there’s a Fibonacci level that’s helped to mark the high at 1.1033, after which a prior price action swing shows around 1.1122.
EUR/USD Weekly Chart
 Chart prepared by James Stanley, EUR/USD on Tradingview
--- written by James Stanley, Senior Strategist


