Euro Talking Points:
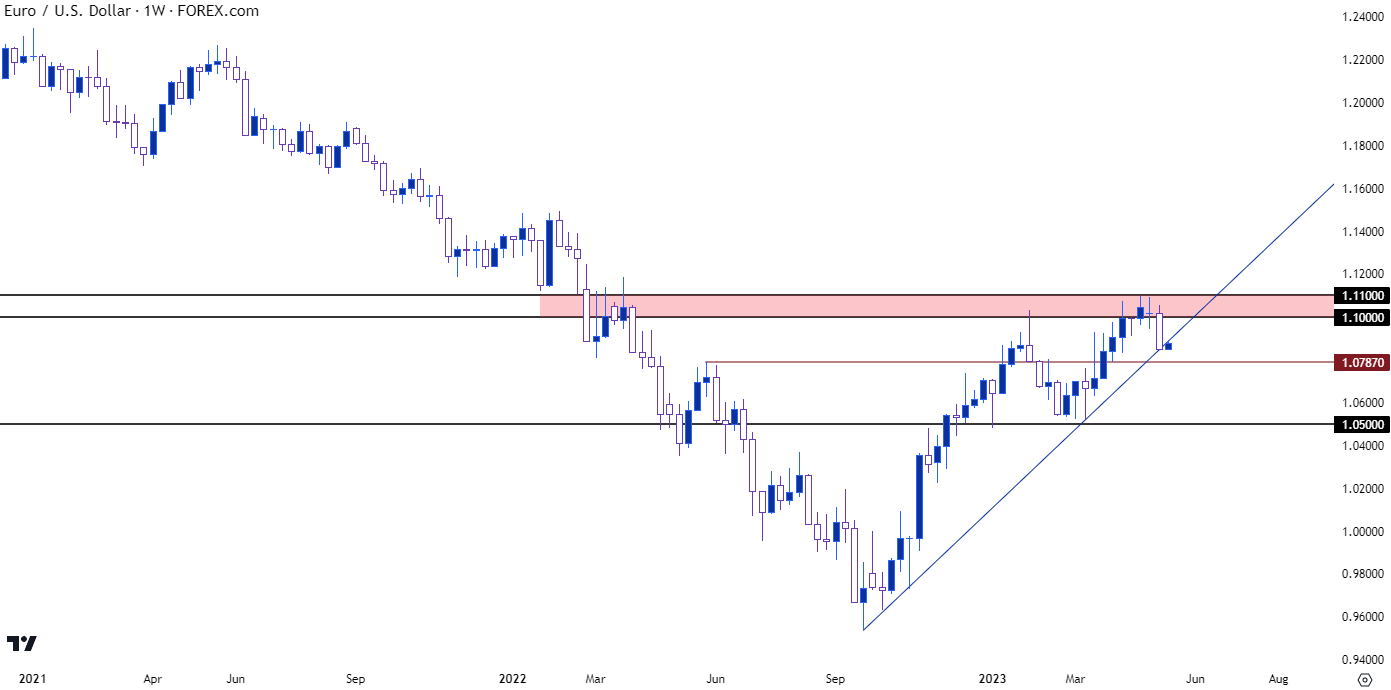
- Last week finally saw some element of trend in EUR/USD as the pair pulled back from a large zone of longer-term resistance, establishing a fresh monthly low along the way.
- The pullback stopped short at a bullish trendline connecting September and March lows, which has helped to hold support through this week’s open. The big question is whether bears can continue the move that they had started last Thursday.
- I’ll be discussing these themes in-depth in the weekly webinar on Tuesday at 1PM ET. It’s free for all to register: Click here to register.
Sellers appeared in EUR/USD last week after the pair spent most of April holding resistance at a key spot on the chart. I had looked into this area as it was coming into play back in late-March, and despite the fact that bulls continued to fire a series of higher-highs in the early portion of the month, they were unable to take control enough to push price beyond 1.1100. Last week finally saw the impasse break as sellers pushed price down to a fresh monthly low. The move stalled around a trendline projection at the end of the week, and that’s so far led to a bounce this week.
EUR/USD Weekly Price Chart

Chart prepared by James Stanley, EUR/USD on Tradingview
EUR/USD Shorter-Term
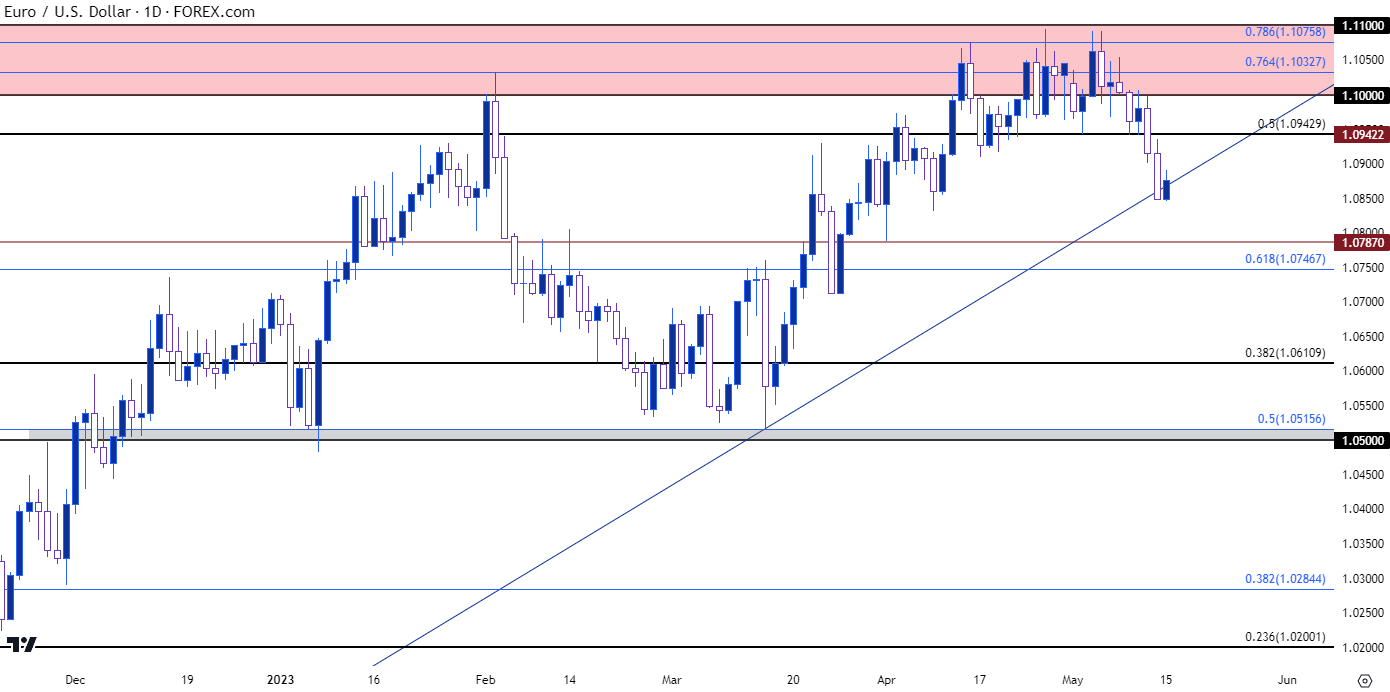
Given that there was a quite a bit of time spent testing that resistance zone, EUR/USD now has a few different levels of interest sitting above current price action now that bears have forced a lower-low. The obvious spot is the 1.0943 Fibonacci level, which helped to set support a couple of different times before the Thursday break. Above that, the psychological level at 1.1000 looms large, and above that price is the 1.1033 and 1.1076 Fibonacci levels from a shorter-term major move, which had previously helped to carve swing highs in February and then early-April.
On the support side of the pair, the 1.0787 level remains of interest as that marks the April low, and below that is a Fibonacci level at 1.0747 which is confluent with a psychological level at 1.0750. Notably, that’s the 61.8% retracement derived from the same study that helped to carve highs in February and April.
Below that, I’m tracking potential support around 1.0611, after which key support comes into view at 1.0500-1.0516, which has held two inflections already this year while helping to define the 2023 swing low, which sits at 1.0483.
EUR/USD Daily Chart
 Chart prepared by James Stanley, EUR/USD on Tradingview
--- written by James Stanley, Senior Strategist


