Euro Talking Points:
- The bearish EUR/USD trend that held through the end of May has spent the first half of June working on a pullback.
- The big question, with FOMC and European Central Bank rate decisions on the docket for the next 24 hours, is whether this pullback can turn into anything more, or whether sellers will show up to defend lower-high resistance to continue the bearish trend that sparked last month.
- I’ll be re-capping these rate decisions and related themes in-depth in the weekly webinar on Tuesday at 1PM ET. It’s free for all to register: Click here to register.
EUR/USD trades at a fresh three-week high this morning, just ahead of the FOMC rate decision scheduled for a little later today. Markets are currently expecting no hikes from the Fed for the first time since January of last year. And then tomorrow brings the European Central Bank rate decision, with the wide expectation that the ECB will hike rates yet again in the effort of further tempering inflation in the Eurozone.
There’s been a noticeable shift between these two Central Banks regarding policy tightening. The Fed started hiking rates last March and began to make larger moves in May (50 bps) and then June (75 bps). The Fed continued with three more hikes of 75 bps until going down to 50 bps last December. Meanwhile, the European Central Bank was gearing up their own rate hikes, but didn’t start moving rates until July, with a bump up to a 75 bp hike in September and then again in November.
This highlights the fact that the low in EUR/USD set last September, just a couple of weeks after that first 75 bp hike from the ECB, probably wasn’t by coincidence, as markets were starting to gear up for a shift between these two major Central Banks. The ECB taking a harder line against inflation while the Fed took a step back to read the data from the hikes they’d already done.
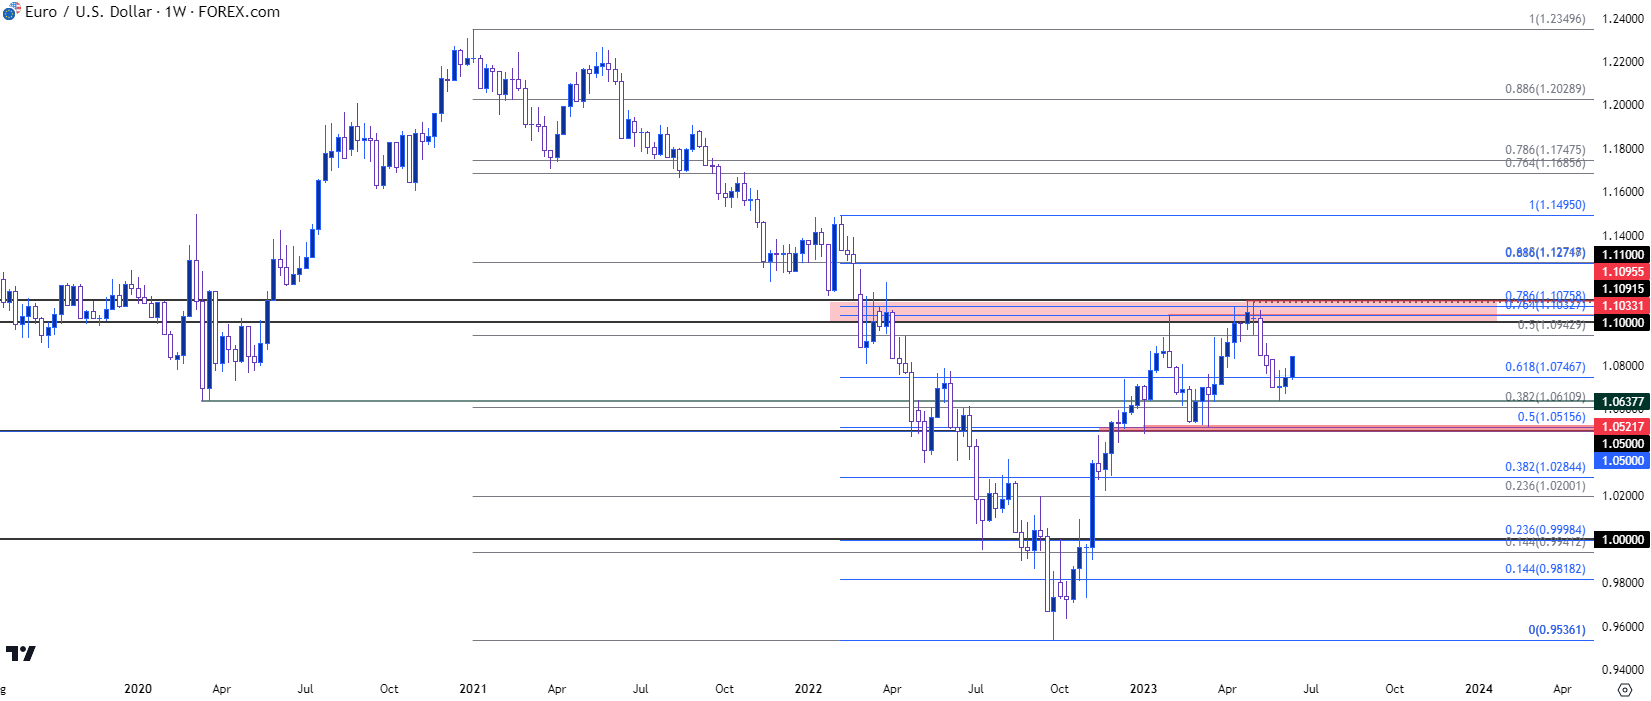
That helped to keep EUR/USD bid into 2023 trade, with a major zone of resistance soon coming into play that remains of issue today. This zone runs around the 1.1000 psychological level and there are a few different Fibonacci levels in tight proximity to qualify this as a confluent resistance zone. I had warned of this zone coming back into the picture in late-March, and it held the highs through April and into May.
The low of the move printed on May 31st at 1.0638, which was the same price that held the lows at the onset of the pandemic in March of 2020.
EUR/USD Weekly Chart

Chart prepared by James Stanley, EUR/USD on Tradingview
EUR/USD Shorter-Term
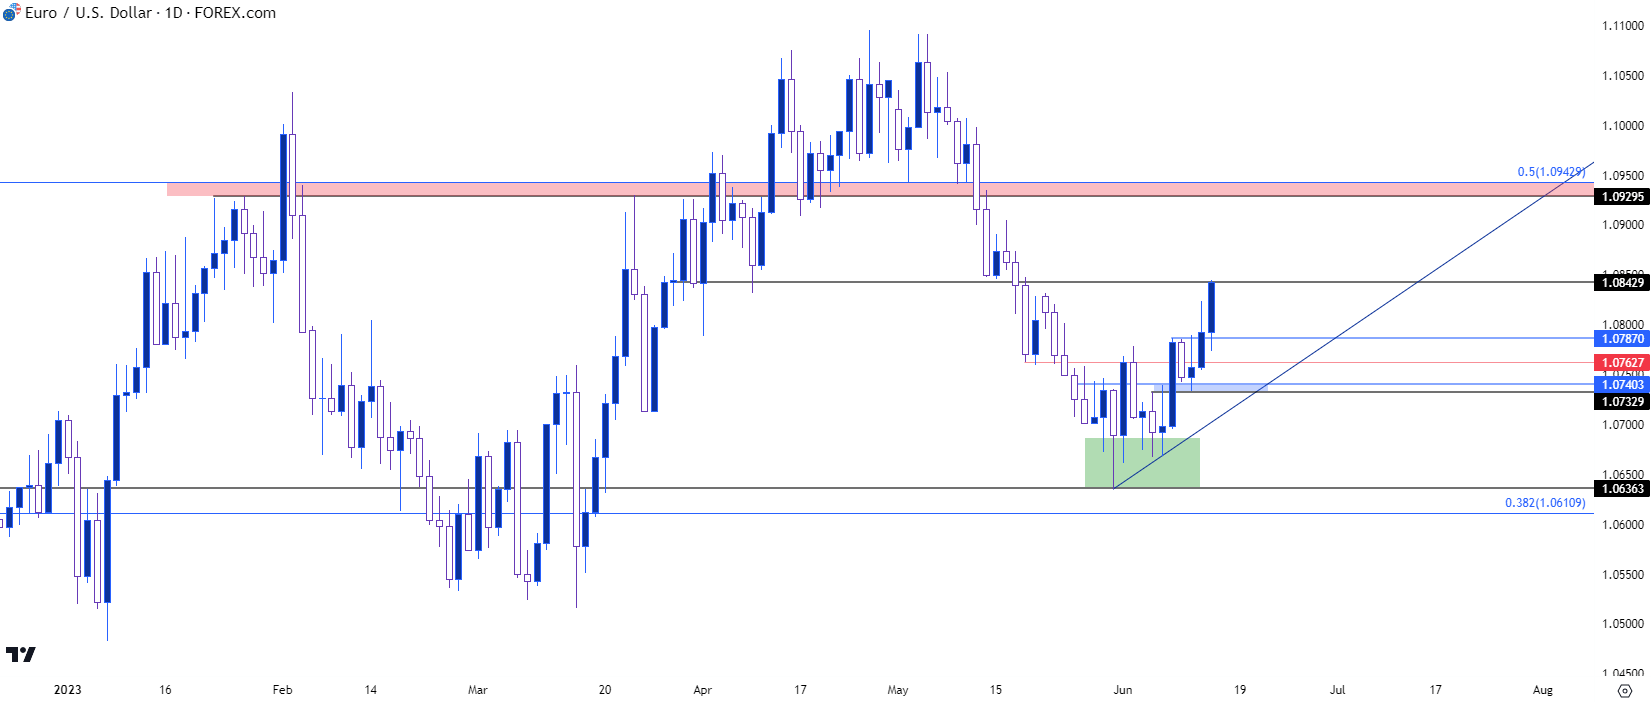
The current pullback began with a stall at support. The 1.0638 level came into play on the final day of May and the first week of June was marked with continued back-and-forth as buyers came into offset the selling pressure. Last Thursday saw a push from buyers to test above the 1.0765 level, which was a prior swing low turned swing high. That move pulled back into last week’s close but buyers have been pushing so far this week and today is showing a stretch from bulls as prices push up to the next level of resistance at 1.0843.
I had talked about this theme in-depth in the webinar yesterday, as well as the article on Monday. And the big question now is how aggressive buyers will remain to be into these two major risk events of FOMC and ECB.
EUR/USD Daily Chart
 Chart prepared by James Stanley, EUR/USD on Tradingview
EUR/USD: Lines in the Sand
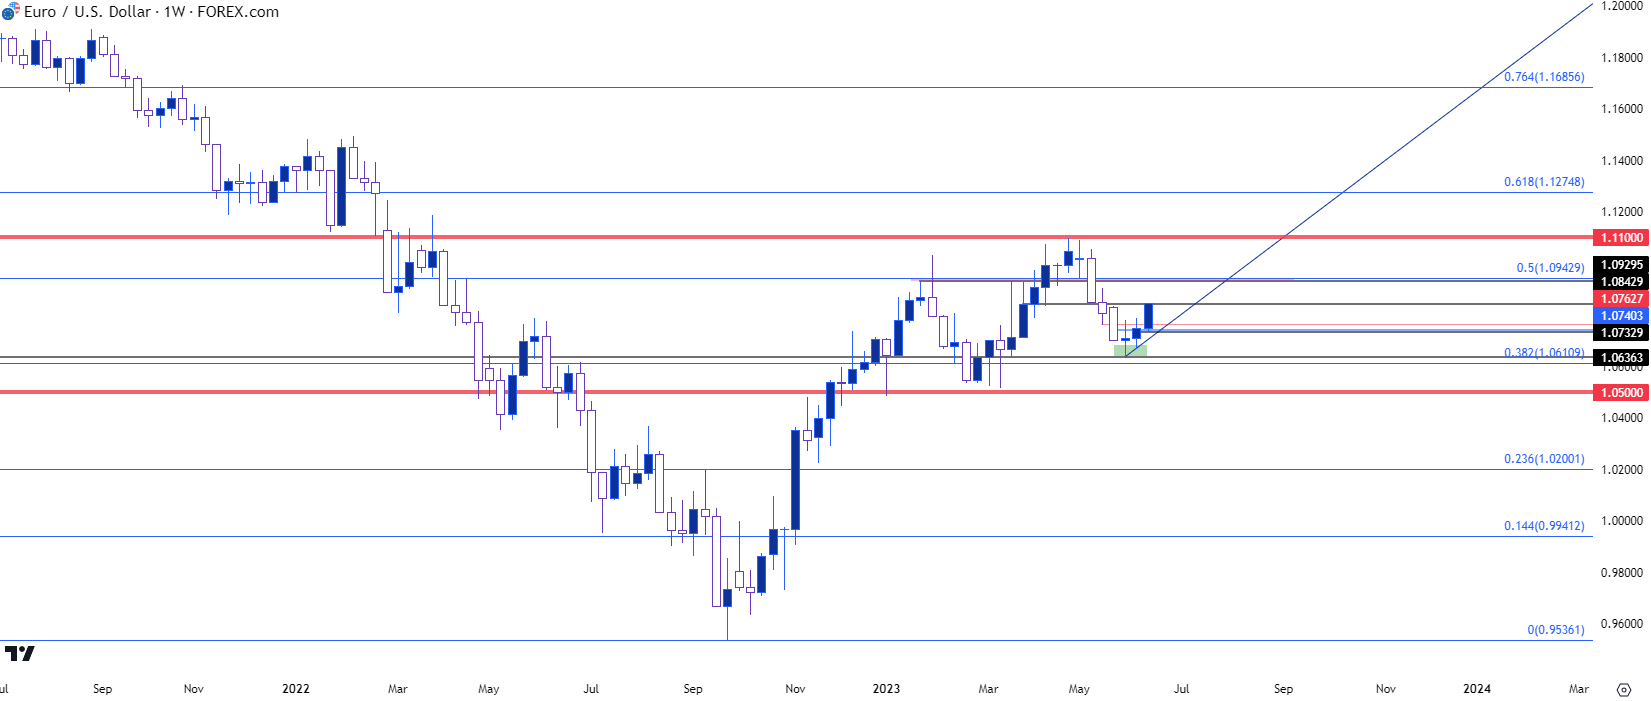
At this point we can make the statement that much of 2023 price action has been consolidation if we take a big picture look at the matter. Sure, there have been some short-term trends to work but bulls haven’t been able to do much beyond the 1.1000/1.1100 resistance zone and bears haven’t been able to take control for very long below the 1.0500 handle.
This can, at the very least, offer a barometer for longer-term trend potential. But, as of this writing, we’re sitting very near the half-way point of that range so the big question is whether any shorter-term trends might spark over the next couple days of drivers. And this highlights shorter-term resistance potential at the 1.0930-1.0943 level. If sellers can’t hold highs there, then the bigger picture resistance area above the 1.1000 handle is vulnerable and this could lead into breakout potential beyond the 1.1100 spot. This would likely require a dovish FOMC outlook from the dot plot matrix combined with a very hawkish ECB outing tomorrow.
The 1.0843 level that I discussed in yesterday’s webinar is already in-play and bulls have control of the matter on a short-term basis. Shorter-term support potential exists in the 1.0733-1.0740 area, after which that swing low from 1.0638 comes into play.
EUR/USD Weekly Chart

Chart prepared by James Stanley, EUR/USD on Tradingview
--- written by James Stanley, Senior Strategist


