Euro, USD Talking Points:
- It was an especially busy week last week with the FOMC and ECB rate decisions to go along with the release of Euro inflation and US jobs data.
- The net of all that headline drive was a doji in EUR/USD, which matched the spinning top from the week prior and the dragonfly doji that printed the week before that. This is three consecutive weeks of indecision as EUR/USD prices remain in a key zone of longer-term resistance.
- I’ll be discussing these themes in-depth in the weekly webinar on Tuesday at 1PM ET. It’s free for all to register: Click here to register.
EUR/USD was making a fast run at a key zone of resistance as the door was closing on Q1. The 1.1000 handle was quite obvious as it’s a major psychological level, and this had helped to stall the advance back in February. But there were a few key Fibonacci levels in tight proximity just above the big figure, with levels at 1.1033 and 1.1076 that each had some element of bearing on April price action.
Now, more than a month later, EUR/USD remains in a range that’s been rather consistent so far with resistance holding around that 1.1076 level that was in-play again last week, just ahead of the European Central Bank’s rate decision. The pair put in a fast drop and quickly tested below the 1.1000 handle but support showed up around a trendline projection, and that led to a bounce on Friday that propelled it back above the 1.1033 Fibonacci level. From the two-hour chart below, we can see the build of this range through late-April and early-May price action.
EUR/USD Two-Hour Price Chart
 Chart prepared by James Stanley, EUR/USD on Tradingview
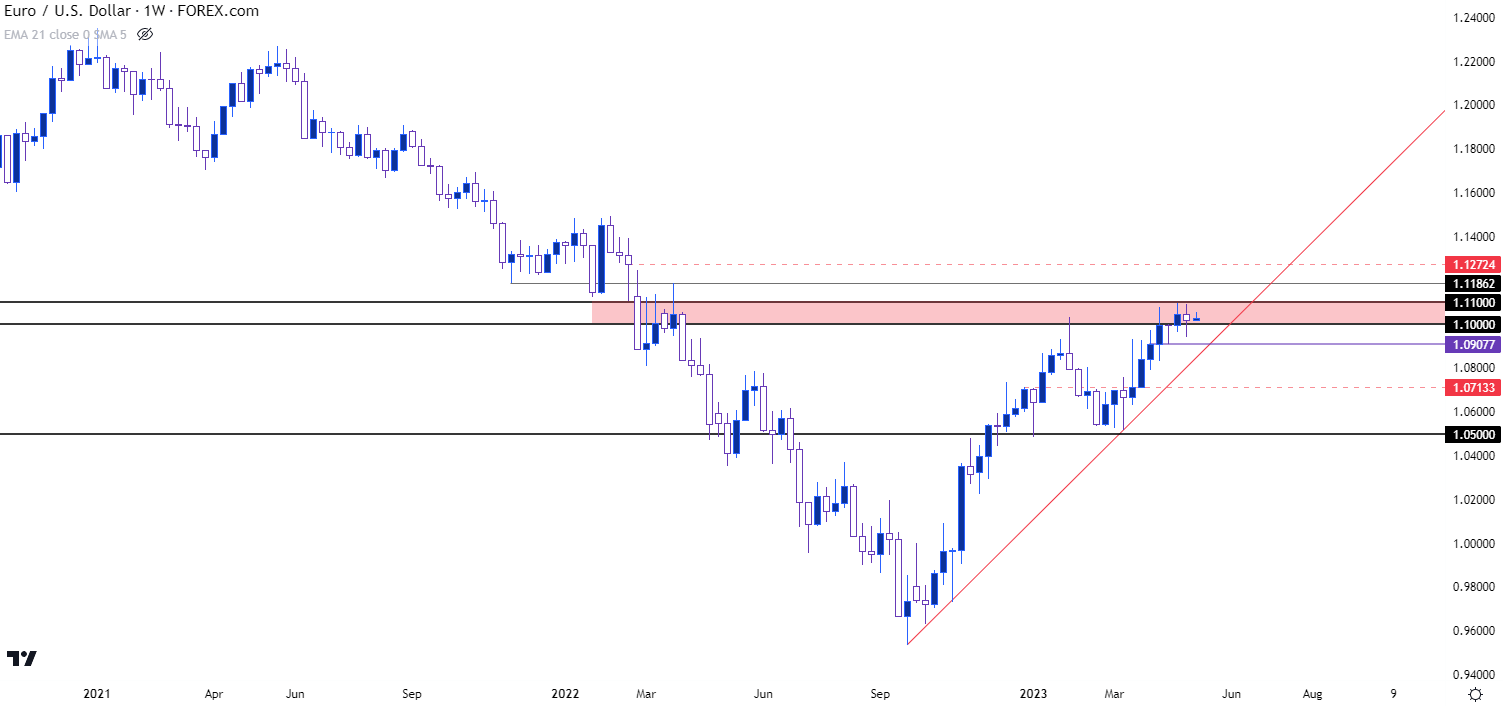
Taking a step back highlights the fact that this range has built around a key zone of longer-term resistance. From the weekly chart below, we can see the initial re-test above 1.1000 taking place earlier in April and, since then, buyers have largely been spinning their wheels, unable to yet test above the 1.1100 handle.
EUR/USD Weekly Price Chart
 Chart prepared by James Stanley, EUR/USD on Tradingview
USD: Focus Shifts to US CPI
If the EUR/USD pair is going to put in a directional move this week, it’s probably going to need some participation from the US Dollar. With the Euro being 57.6% of the DXY quote the fact that EUR/USD has been pinned near resistance coincides with a similar scenario of the USD holding near support. I had talked about that in US Dollar Price Action Setups over the weekend, and it’s the Wednesday release of US CPI data that looks to be the big item on the horizon for the greenback. The expectation is for continued softening, with headline inflation at 5% and Core CPI falling down to 5.5% from last month’s 5.6% print.
Even a 5.5% print indicates strong inflation, and when coupled with the 3.4% unemployment reading on Friday from the NFP report, this makes for a backdrop that could be difficult for the Fed to force a pivot, even into a pause. If that CPI report comes out hot on Wednesday, to go along with the Friday NFP report, there could be fundamental motive on the long side of the USD, particularly after the ECB has scaled down to 25 bp hikes.
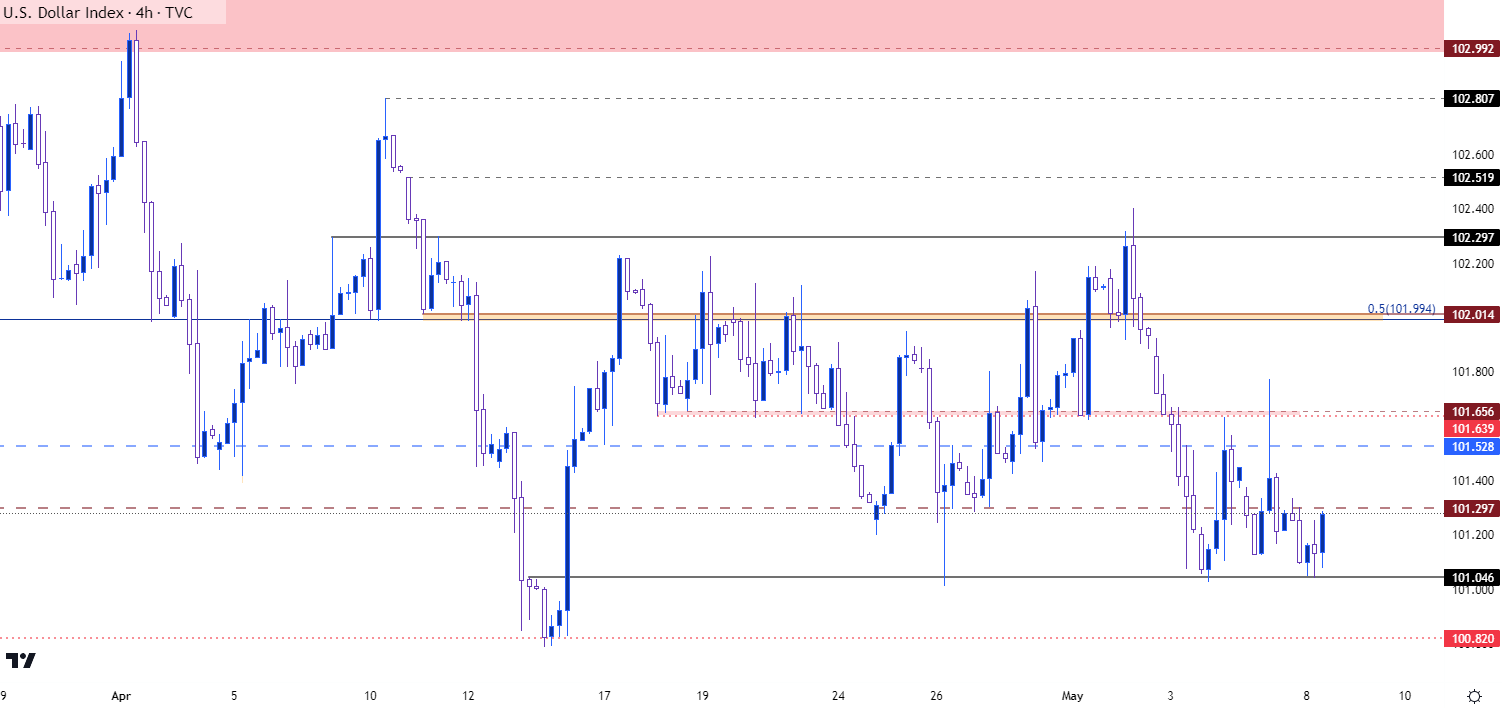
In the USD, like EUR/USD above, there’s been a recent build of a range. I’m tracking the bottom of the range around the double bottom formation at 100.82, and there’s been a penchant for support to hold at a higher-low of late, around 101.05. On the resistance side of DXY, it’s the 102 and 102.23 levels that continue to loom large as they’ve held a number of resistance advances, most recently last Monday.
Between support and resistance, there’s a number of additional levels, such as 101.30, 101.53 and 101.65 that have all had some show of support and/or resistance, and this can offer some context for swing traders looking to operate within the range.
US Dollar - DXY Four-Hour Price Chart (indicative only, not available on Forex.com platforms)
 Chart prepared by James Stanley; data derived from Tradingview
--- written by James Stanley, Senior Strategist


