Euro Talking Points:
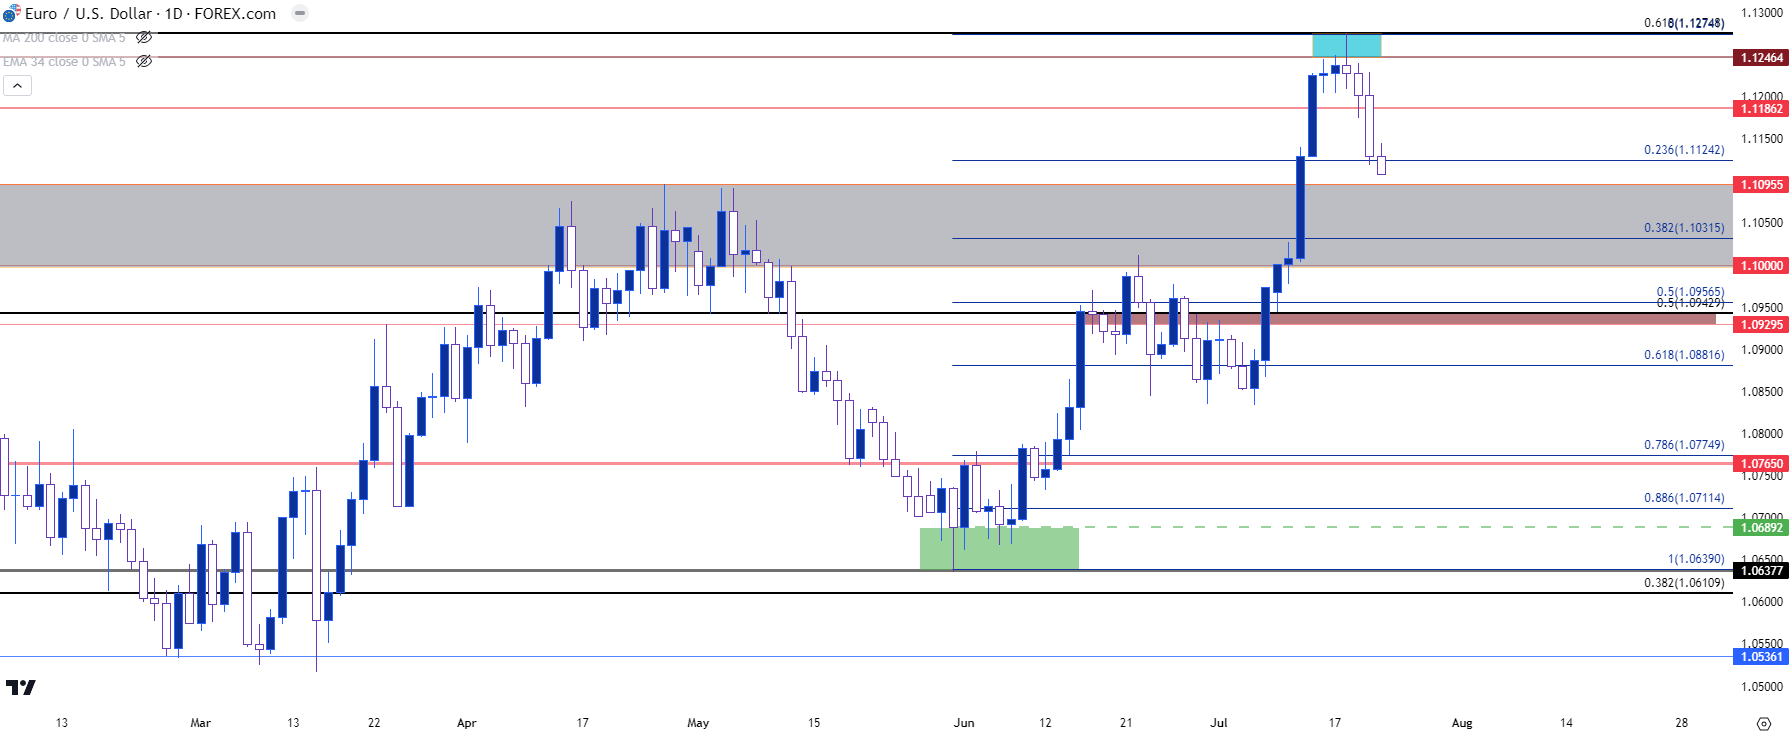
- The EUR/USD breakout took a step back after running into a key level on Monday at 1.1274.
- This week saw bears return in the pair, but this may turn out to be a pullback type of scenario as there’s a major zone of long-term support just below current price. FOMC and ECB rate decisions are on the calendar for next week, so that will likely have some impact on how these technical scenarios are rectified.
- I’ll be discussing these themes in-depth in the weekly webinar on Tuesday at 1PM ET. It’s free for all to register: Click here to register.
EUR/USD came into the week with a full head of steam, as a strong breakout had pushed price through a significant zone of resistance in the prior week, helped along by another soft print in headline CPI out of the United States.
But – as I warned on Monday, a major zone of resistance was in-play as there was a prior swing around the 1.1250 psychological level, and just above that at 1.1274 is the 61.8% retracement of the 2021-2022 major move. And the 50% mark of that same setup played a big role during the range that built in the first half of the year, so that made the potential for something to show a bit more attractive.
The resistance inflection happened on Monday, and Tuesday saw bears make a little more ground which I discussed in the webinar. I also outlined in that webinar a short-term double bottom formation in the US Dollar, which kept the door open for pullback there. And given how the USD had become oversold from a number of vantage points, there was an open door for a pullback in the broader bearish trend. That scenario continued to play out on Wednesday and Thursday, with USD pulling back to the 101 level.
The big question in EUR/USD is whether bears can make ground below the zone of prior resistance that runs from around 1.1000 up to 1.1096. That was a key zone of resistance in the first half of the year and only gave way after the CPI report earlier in the month. But, notably, there was little bullish drive above that area which raises the prospect of capitulation. But, for that, we’ll need to see more follow-through from bears next week.
EUR/USD Daily Chart
 Chart prepared by James Stanley, EUR/USD on Tradingview
EUR/USD Longer-Term
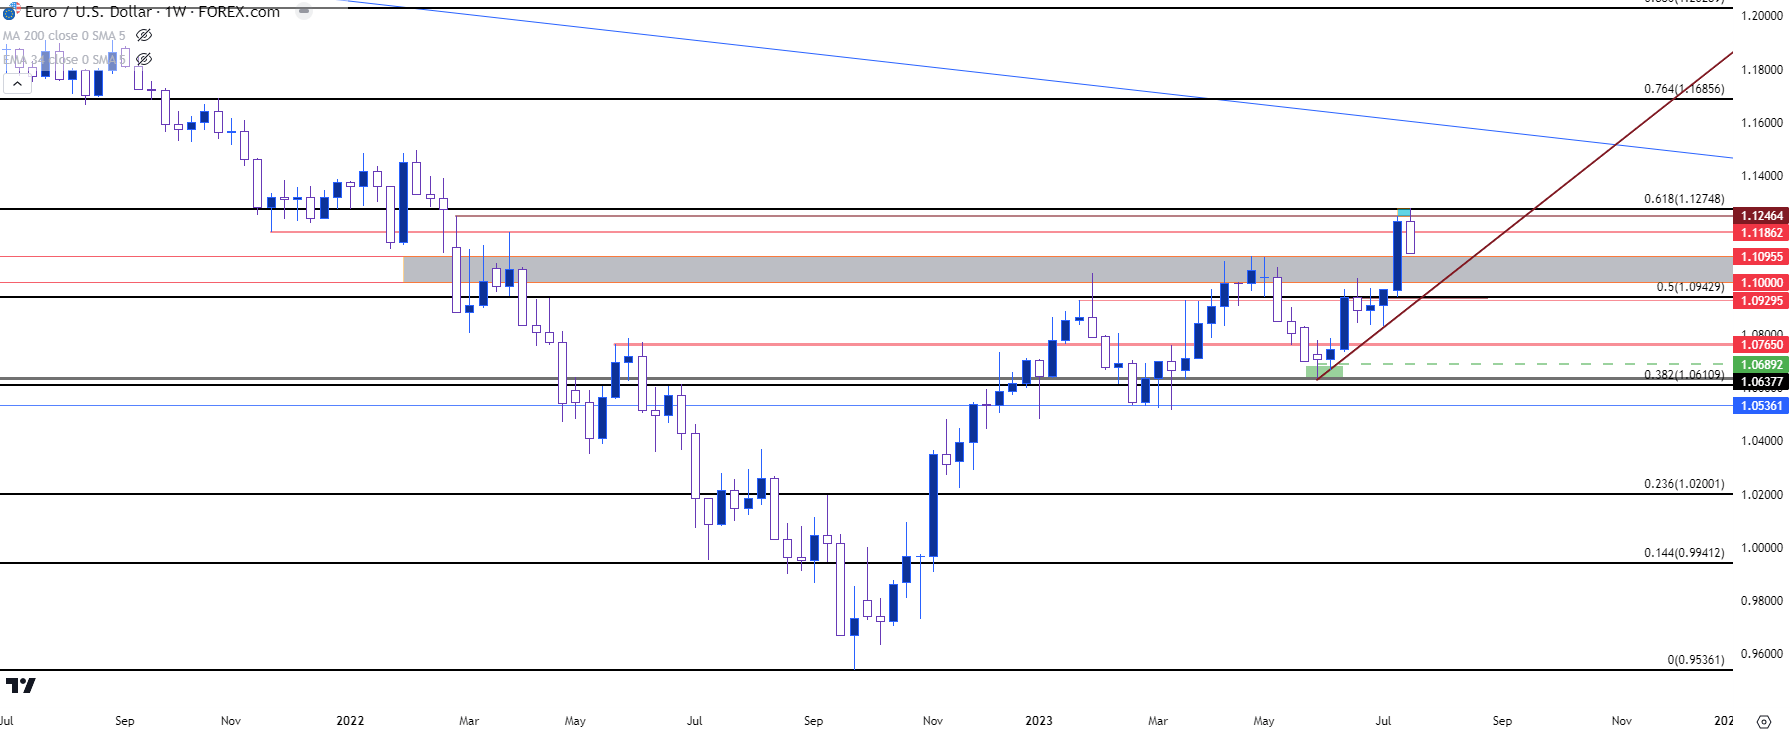
Since there’s rate decision on the calendar next week, we can take a step back to the weekly chart to entertain some projections. For the first-half of the year EUR/USD remained constrained at that 1.1000-1.1096 area on the chart, and a likely reason was market expectations around rate hikes. While core inflation remains above target in both the US and Europe, growth in each economy is not on an even keel, which exposes Europe to more vulnerability with continued hawkishness. To date, the ECB hasn’t voiced much concern on the matter, instead keeping a hawkish pace in effort of stemming inflation. The Fed, meanwhile, have been far more open to the topic which has likely helped to build some of the expectation for the Fed to finish with hikes after next week’s rate decision.
The question for next week is which Central Bank can convince the market that they’re more-hawkish. The ECB may have an advantage here, as they’ve suspended forward guidance so market participants have to do far more projection on the basis of commentary from ECB members, while the Fed is still issuing a dot plot matrix that invariably steals the market’s attention, even with a rate hike widely-expected.
So, there could be potential for a larger move of USD strength and EUR/USD weakness; but as of right now, the chart shows last week’s moves as pullbacks in broader themes. In the EUR/USD, that’s a pullback in the bullish theme which could keep bulls in order while USD has pulled back for tests of lower-high resistance.
In EUR/USD, there’s remaining support potential just below this week’s low, and if next week brings damage to support that reversal theme could start to look a bit more attractive.
EUR/USD Weekly Chart
 Chart prepared by James Stanley, EUR/USD on Tradingview
US Dollar
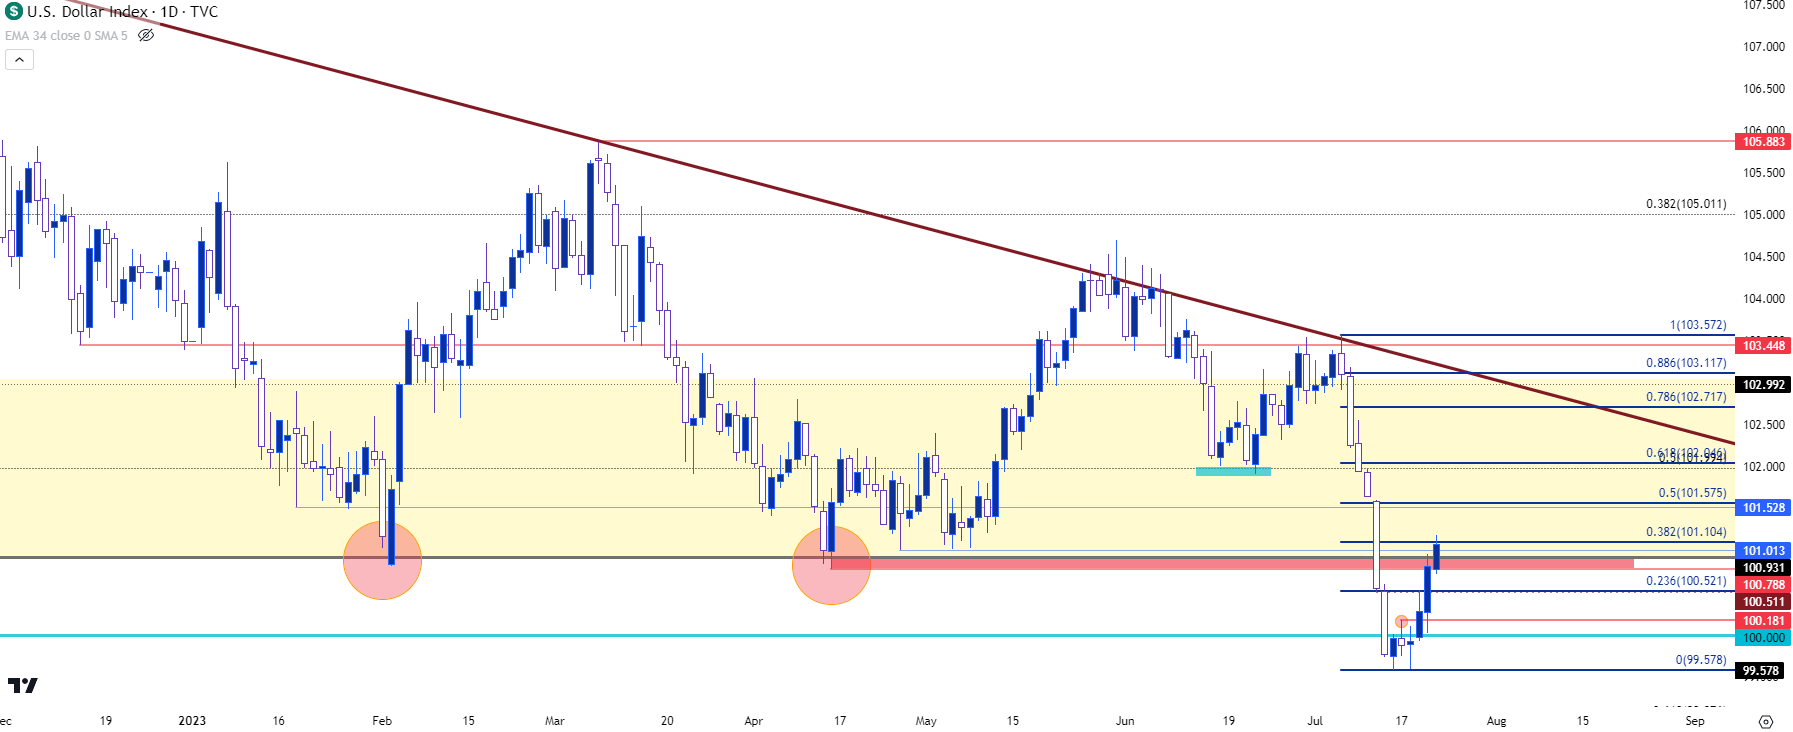
Similar to EUR/USD above, we have a previously strong trend that put in a clean pullback over the past week, so this sets the shorter-term and longer-term directional themes at odds. In USD, the bullish move over the past week amounted to a 38.2% pullback in the prior bearish move, and there are a couple of key levels a little higher on the chart, drawn from that same Fibonacci retracement and confluent with prior price swings.
Around 101.50 is a swing low from January that’s come back into the picture a few times since, and that’s also around the 50% mark of that retracement. And perhaps the larger level is a bit higher, around 102, which is the 50% mark of the longer-term, 2021-2022 major move, and also the 61.8% retracement of the recent sell-off.
Both areas represent opportunities for bears to jump back into the trend, which can relate to the above scenario in EUR/USD with the support zone running from 1.1000-1.1096. And given that there’s rate decision out of the US on Wednesday and Europe on Thursday, there could be ample motive to drive some volatility in each market.
US Dollar - DXY Daily Price Chart (indicative only, not available on Forex.com platforms)
 Chart prepared by James Stanley; data derived from Tradingview
EUR/JPY
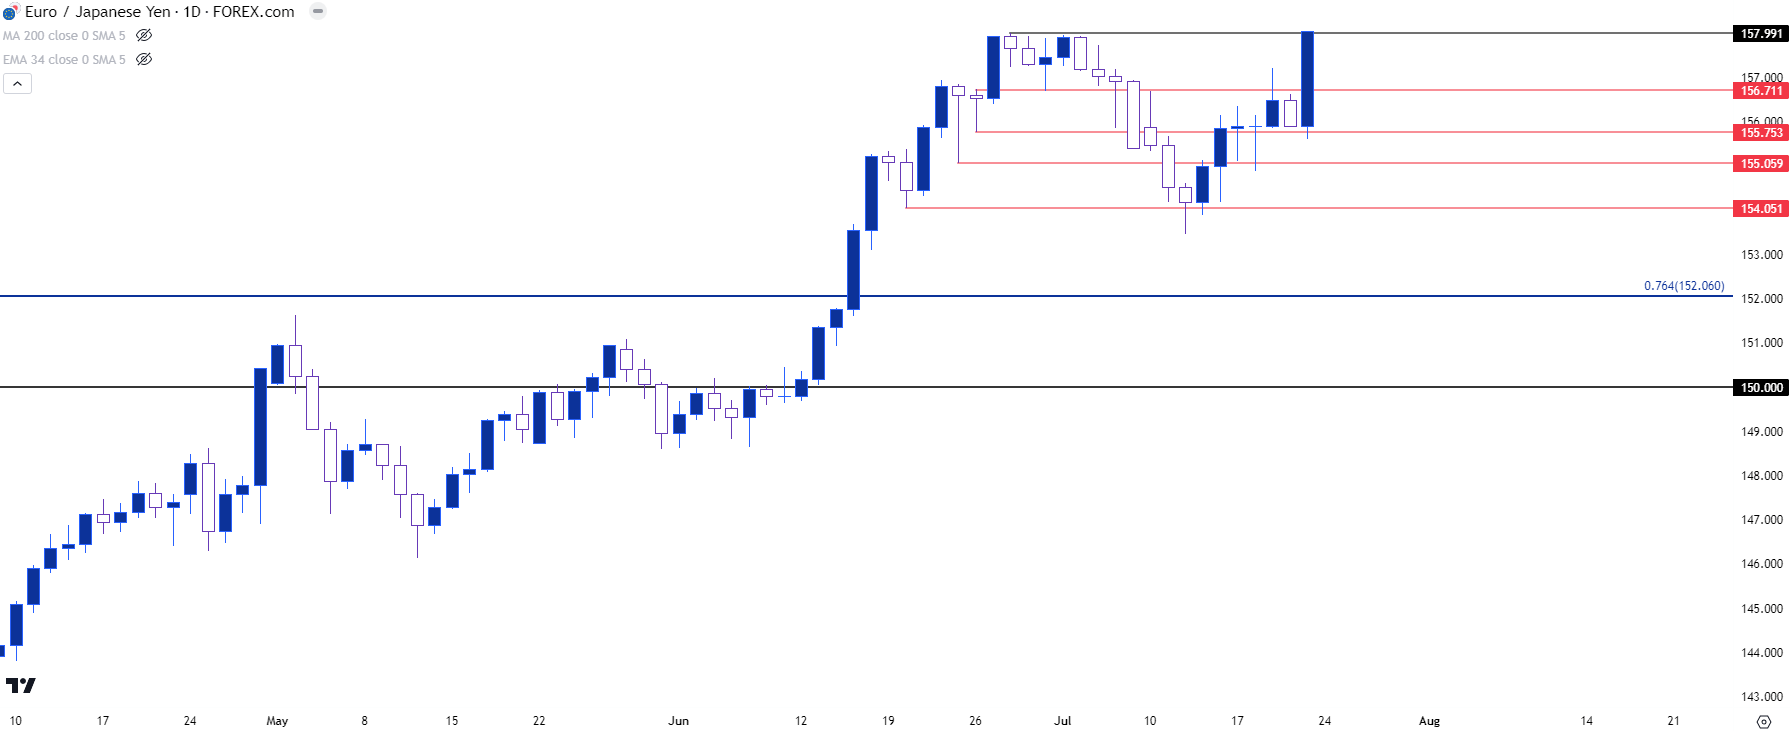
While EUR/USD has some questions for directional themes, EUR/JPY has had a far more bullish outlay of late. This week, particularly Friday, was marked by profuse strength with a bullish outside bar printing with price jumping right up to resistance at the 158 handle.
That resistance has held multiple tests already, and the Friday bar closed right at the highs, which can make for a challenge if chasing. There is support potential from prior resistance, however, around the 156.71 level. If bulls can’t defend the 155.75 support, questions will populate around bullish breakout potential. But, given the momentum from Friday, buyers have made a statement here and bulls retain control until something shifts.
EUR/JPY Daily Price Chart
 Chart prepared by James Stanley, EUR/JPY on Tradingview
--- written by James Stanley, Senior Strategist


