Euro, EUR/USD Talking Points:
- EUR/USD put in a steep fall last week on the heels of the U.S. CPI report and the ECB rate decision.
- Last week’s low held into the weekly close around the swing low from March of 2020, when the pandemic was getting priced-in.
- Longer-term, there remains range support down to around the 1.0500 handle. And while trend potential does exist with a move such as we saw last week, there’s a lot of Fed-speak on the calendar and the U.S. Dollar has pushed into overbought territory on the daily chart. This keeps the door open for pullback scenarios. The big question at that point is when, where or how bears react to lower-high resistance.
- This topic will be front-and-center for the price action webinar, which you’re welcome to attend. It’s free for all to register: Click here to register.
- The Trader’s Course has been launched and is available from the below link. The first three sections of the course are completely open and this focuses on fundamental analysis, technical analysis and price action.
Last week was a brutal outing for EUR/USD bulls, but it didn’t start that way. A bounce showed from 1.0796 support last Monday and price pushed back-above the 200-day moving average. But, as I warned in the Tuesday webinar, with DXY also trading above its 200-dma, it was unlikely for both markets to remain above their respective 200-day moving averages for long.
The Wednesday release of U.S. CPI brought a visible move of weakness to the pair while completing an evening star pattern on the daily, and that continued through the Thursday ECB rate decision.
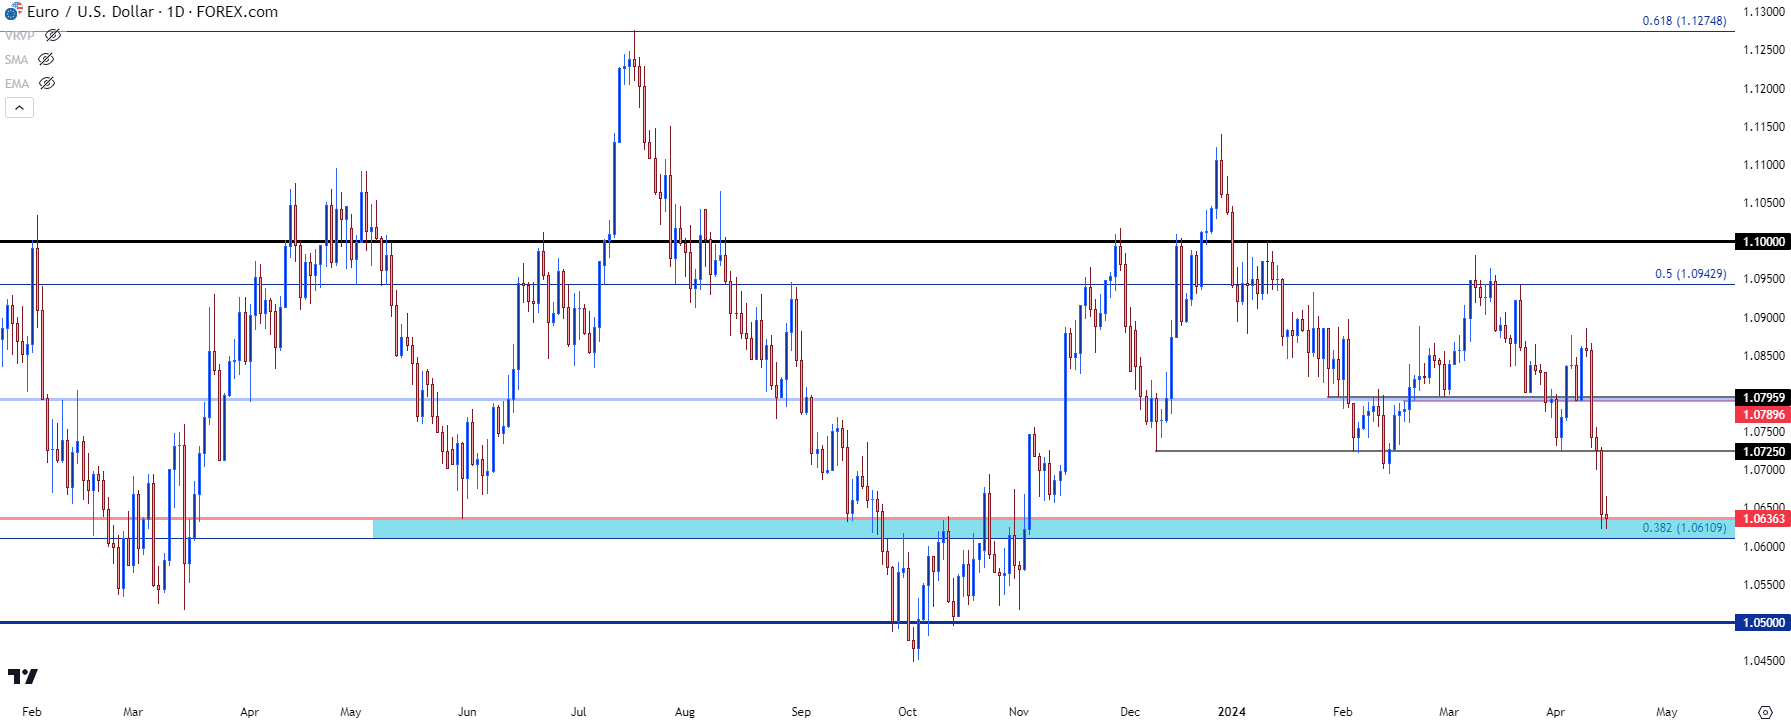
Friday saw the knives come out, however, as the pair hurriedly dropped below the 1.0700 handle until, eventually, pushing down to find support at 1.0636, which is a key price level. This was the low from March of 2020, as the pandemic was getting priced-in, and this same price came back into the picture last May 31 to help set the low, after which a 600+ pip reversal developed over the following seven weeks.
EUR/USD Daily Price Chart
 Chart prepared by James Stanley, EUR/USD on Tradingview
The EUR/USD Range
The U.S. economy has significant ties with the Eurozone and the argument can be made that it would be difficult for one economy to remain unscathed should the other go into recession. It’s probably possible, to be sure, but with the Euro as a 57.6% allocation of DXY, the inter-play between the two economies is significant. And currencies are key – as that is the base of the financial system and there can be widespread and massive repercussions of currency price movements. And such as we saw in 2022, when the U.S. was picking up rate hikes in larger increments and the European Central Bank was standing pat, a one-sided run in the EUR/USD pair could produce some nasty ramifications.
A sliding Euro means upward pressure on European inflation. Take, for example (and this is purely a hypothetical example for illustrative purposes), an American company selling goods and services in Europe. If Apple is selling a MacBook for €1,000 when the EUR/USD spot rate is at 1.2000, well every MacBook sold means $1,200 in revenue. If we assume a 10% margin that would mean $120 of that $1,200 is profit.
But – if EUR/USD suddenly drops to parity, and Apple is still selling MacBooks in Europe for €1,000, well now they’re only bringing back revenue of $1,000 per MacBook sold – and given their $1,080 cost structure, that would mean that they would be losing money on every MacBook sold.
This isn’t the type of thing that Apple usually does. Instead, they’ll probably look to boost prices to offset that newfound currency weakness and other computer manufacturers in Europe take notice, and they now have motive for boosting prices, as well. This is inflation, and can be driven by something as simple as a falling currency value.
So, when EUR/USD was falling in 2022 and inflation was boosting higher in Europe, the ECB was being pushed deeper-and-deeper into a corner until, eventually, they had to start hiking rates by larger amounts. This is what ultimately helped EUR/USD to reverse in Q4 of 2022 with the ECB pushing their own 75 bp rate hikes.
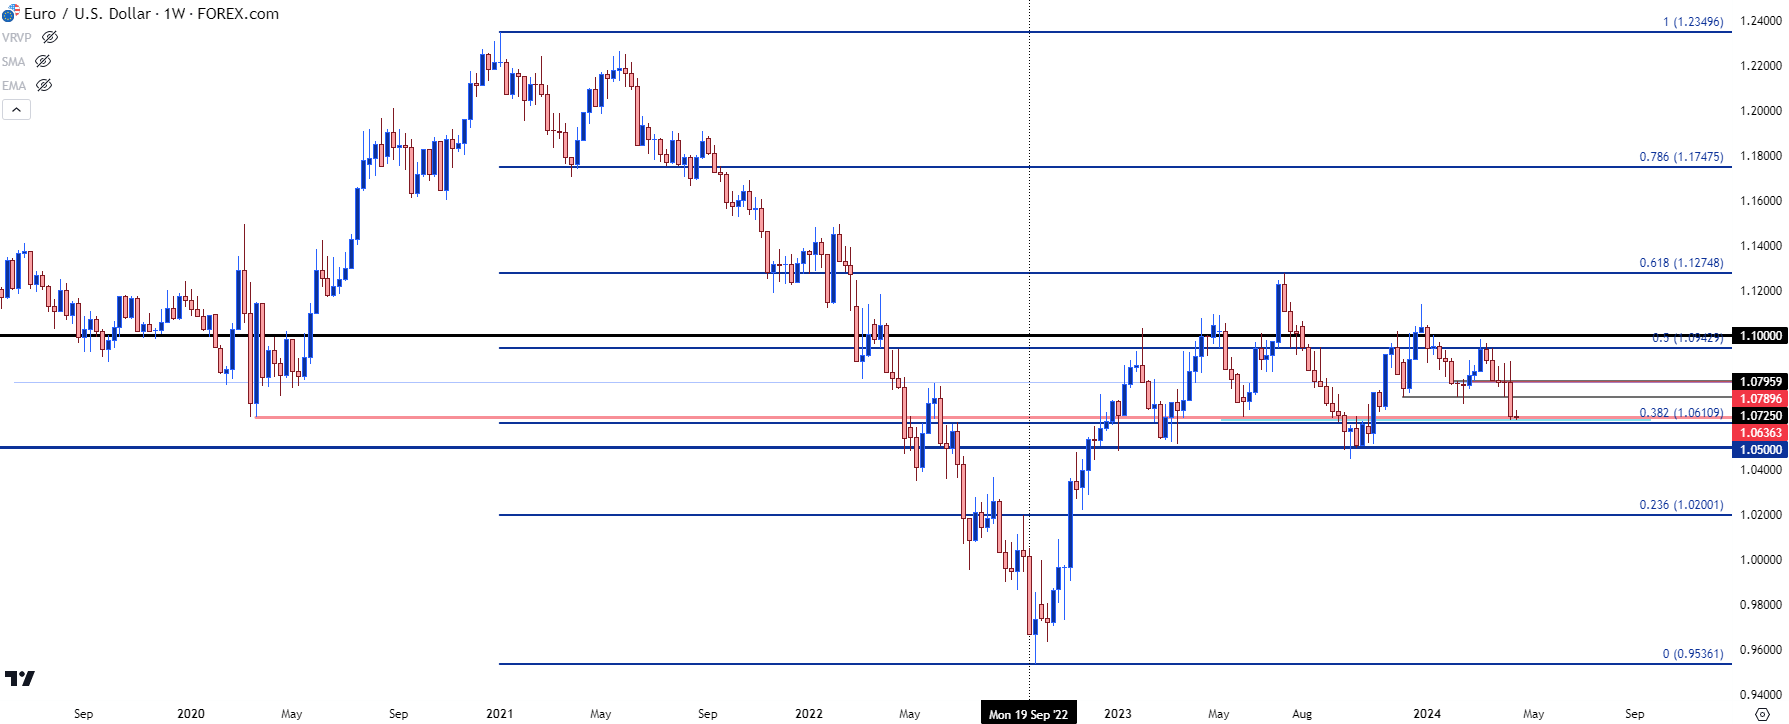
That led to a slingshot-like move that held through the 2023 open; but shortly after the pair went into a range and it’s pretty much held ever since.
EUR/USD Weekly Price Chart
 Chart prepared by James Stanley, EUR/USD on Tradingview
Euro, USD Balance
The Fed has seemed to be very dovish of late; and meanwhile the ECB has seemed to be a bit more-hawkish than what data would otherwise warrant, at least in my opinion. And the fact of the matter is that likely both the Fed and the European Central Bank would want some element of balance in the EUR/USD exchange rate.
A super-charged USD with a weak Euro would allow the U.S. to essentially export inflation to Europe, like we saw in 2022. But that could also take growth along with it as a strong USD could produce a number of problems elsewhere.
This may be another reason to explain the still-dovish lean at the FOMC despite the continued strength in both American labor markets and Core CPI. The USD rally that was seen in 2022 also came along with crumbling equity prices and it was around the US Dollar top in Q4 of 2022 that stocks started to come back to life.
If the Fed ‘sticks out’ as one of the few hawkish Central Banks, that could drive more flows into USD which could then come along with that threat to growth and a pressure point for equity markets. It may also help with inflation, but it seems that the Fed remains hopeful that inflation will continued to trend-lower.
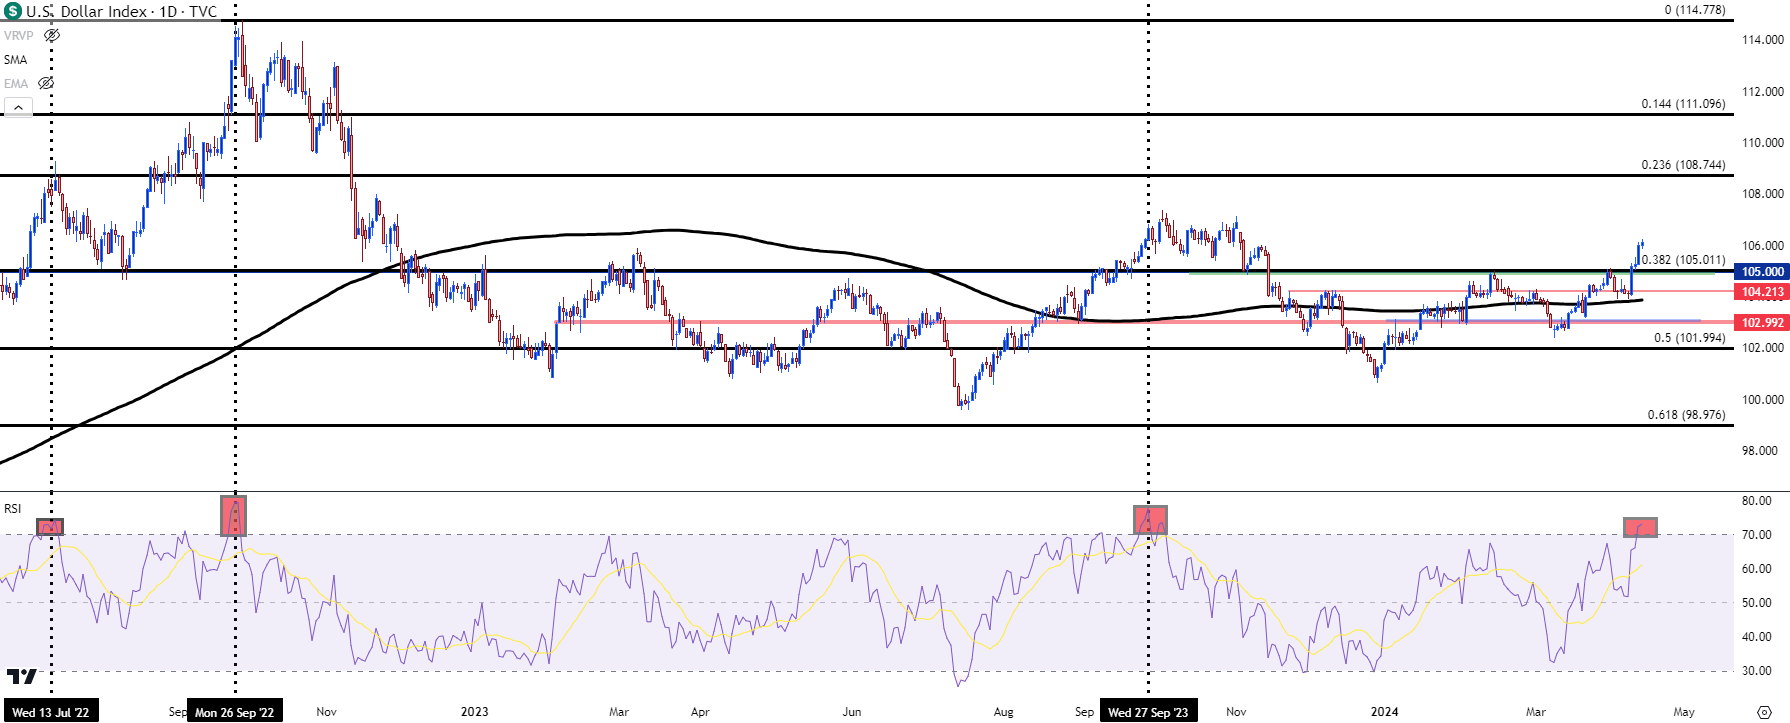
Nonetheless, this begs the question as to whether the range in EUR/USD is ready to relent and there’s a couple of factors to consider for this week on that front: The U.S. Dollar is now overbought on the daily chart and that’s something that hasn’t happened since the currency topped last year. And the prior overbought episode before that was when DXY had topped in 2022. There’s also a lot of Fed-speak on the calendar, and while Kashkari has already mentioned the possibility of no cuts this year, many other Fed members remain at least somewhat dovish, and that could similarly pull USD bulls back from resistance.
So, if USD bulls and EUR/USD bears are going to push the trend this week, the next significant spot of support is around the same 1.0500 handle that’s been tested as range support twice since the 2023 open. And USD would need to continue pushing through overbought conditions on the daily chart which has been somewhat of a stumbling block, as we can see from the prior three instances going back to July of 2022 on the below chart.
U.S. Dollar Daily Price Chart
 Chart prepared by James Stanley, EUR/USD on Tradingview
EUR/USD Strategy
At this point EUR/USD has pushed down very close to longer-term range support; and the U.S. Dollar is already overbought from the daily chart. This could produce a scenario for pullback potential, especially given the Fed-speak on the calendar for this week. The bigger question is whether bears use that pullback to position-in at lower-highs, which can keep the stage set for a deeper support test.
So, there are a couple of ways this could roll out: If sellers make a fast push down towards 1.0500, that would extend the overbought backdrop in the USD, which would make pullback scenarios in EUR/USD a bit more attractive off the 1.0500 handle and given the stretched nature of both markets in that scenario, that pullback could turn into a possible reversal.
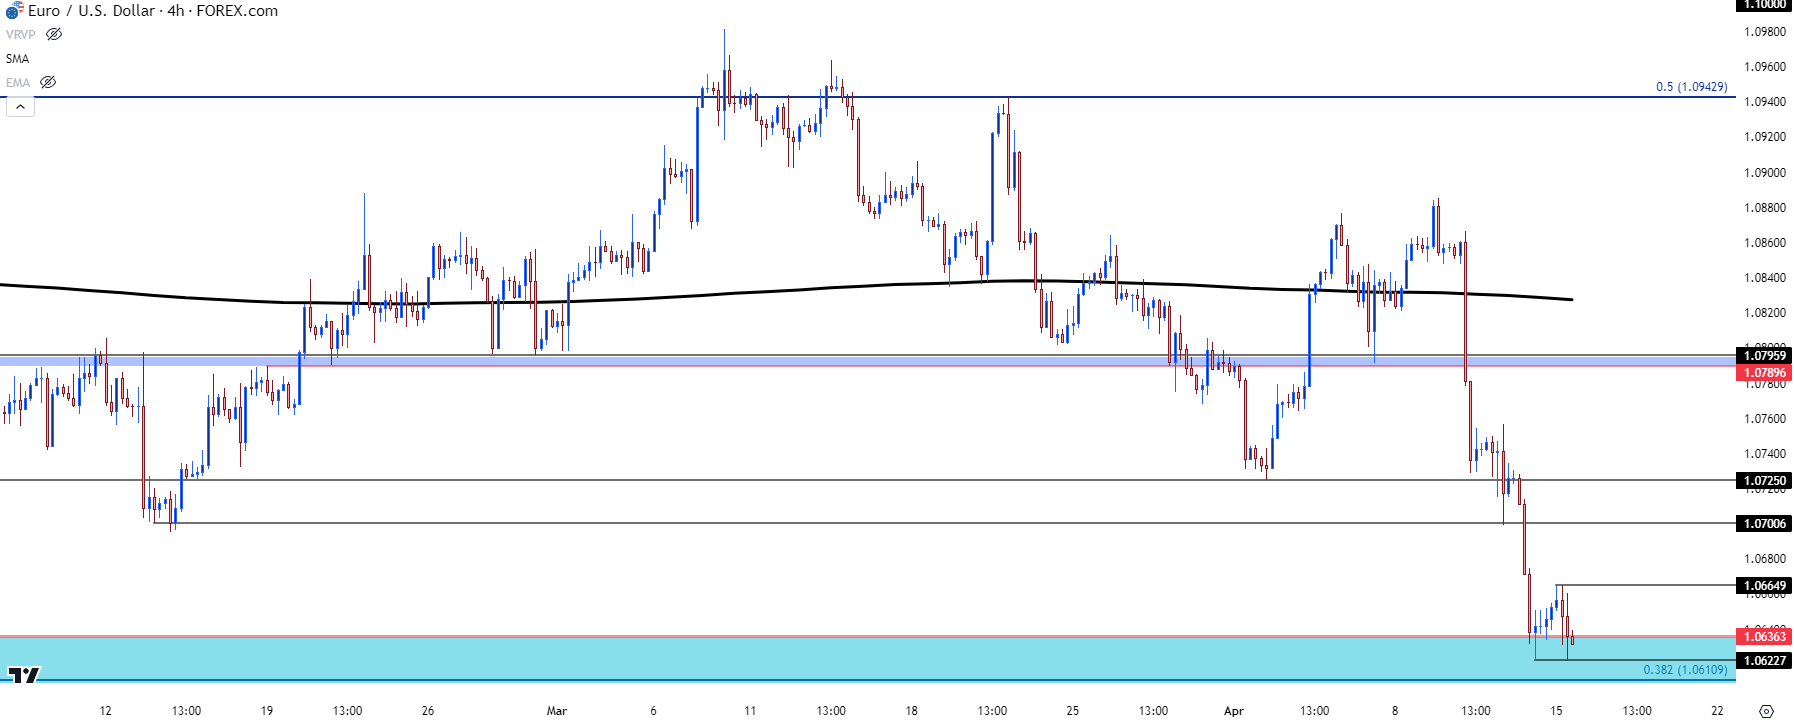
For trending potential, a pullback from current support, which is playing-in off the pandemic low at 1.0636, could set the stage for bears to defend resistance at prior support, at a spot such as the 1.0700 or 1.0725 levels. Above that is another key zone of prior support, around the 1.0796 level, and above that is the 200-day moving average which currently plots around 1.0827.
EUR/USD Four-Hour Price Chart
 Chart prepared by James Stanley; data derived from Tradingview
--- written by James Stanley, Senior Strategist


