Euro Talking Points:
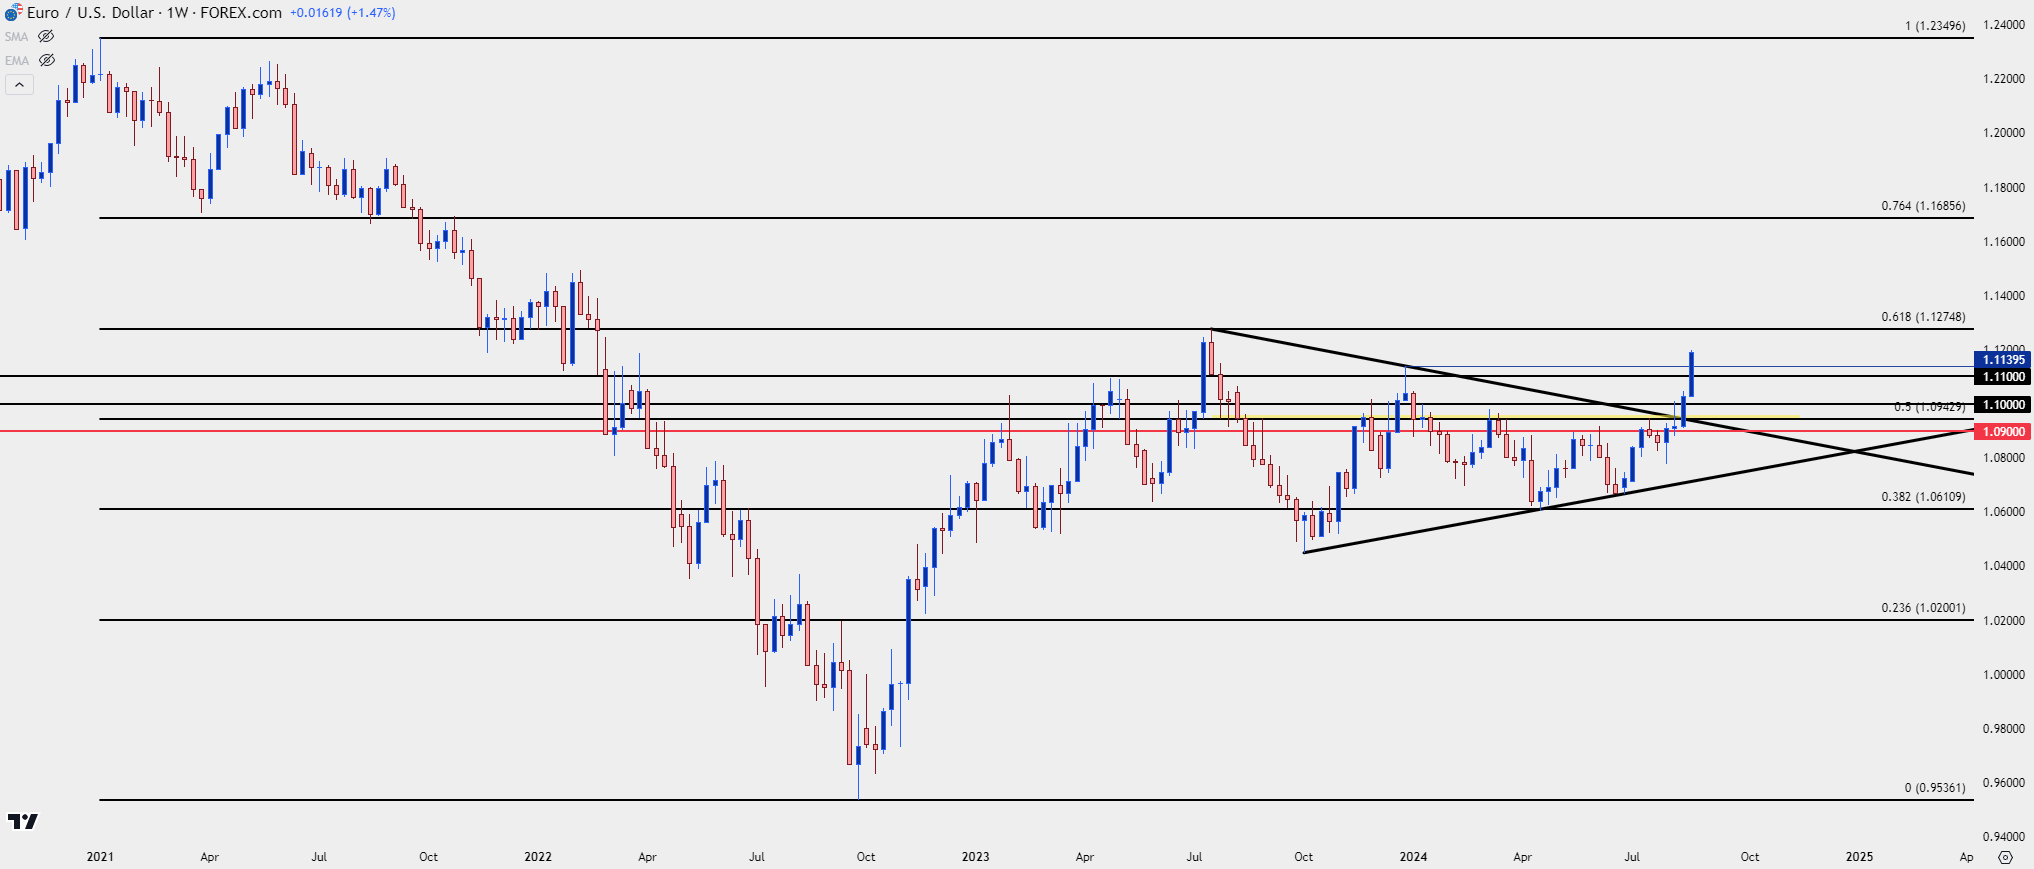
- It’s been another big week for EUR/USD with the currency pair extending its bullish trend to fresh yearly highs. The past week has been the strongest weekly outing since November of 2023, and so far, August has been the strongest monthly showing since November of 2022.
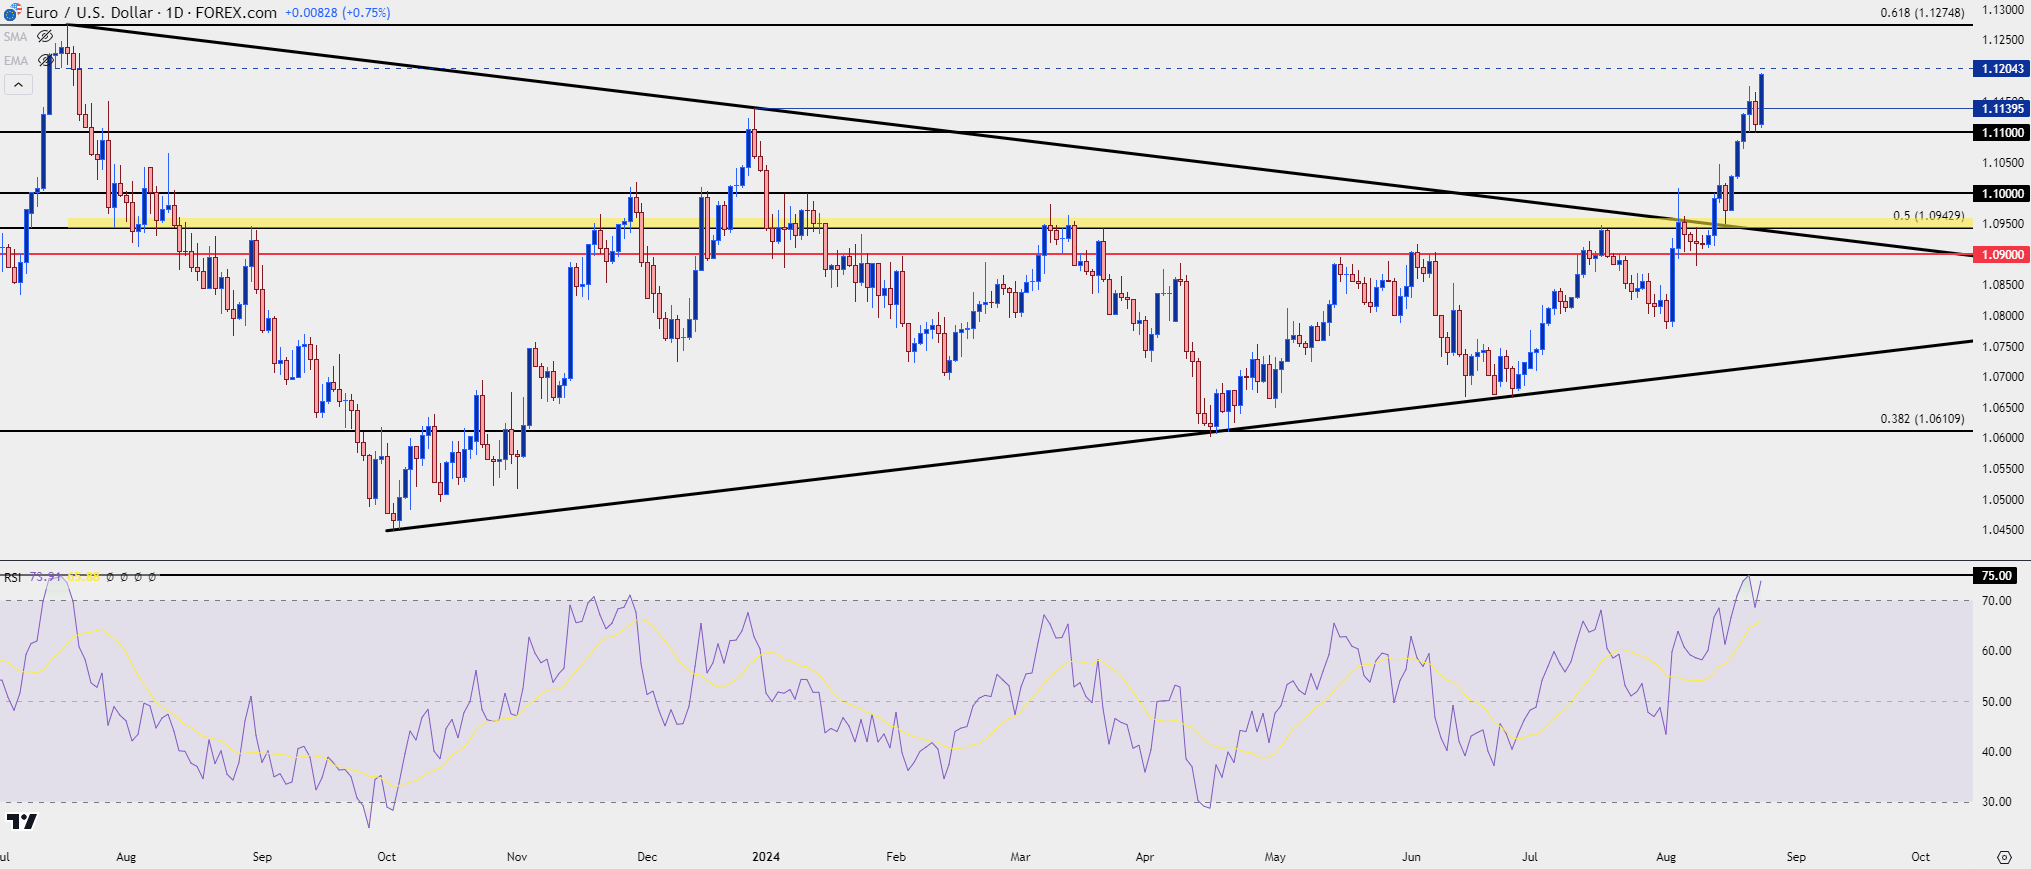
- A strong pullback showed on Thursday but as I shared in the video later that day, the 1.1100 level was a big spot of support and that led to a launched move on Friday after the Powell speech at Jackson Hole.
- I’ll be looking into these setups in the Tuesday webinar and you’re welcome to join, click here for registration information.
EUR/USD put in another strong move over the past week and even with that being the fourth consecutive weekly gain, the pair has showed its largest weekly move since November of last year. In that last iteration, the pair was driving-higher after a dovish FOMC meeting on the first of the month and a below-expected CPI report a couple weeks later. That gave the USD a push-lower and, in-turn, a bullish breakout in EUR/USD that saw the pair push up to the 1.1000 handle a couple weeks later.
In this iteration, the breakout was already in as EUR/USD had pushed above the resistance side of a symmetrical wedge last week and then continued through the first three days of this week, eventually setting a fresh yearly high on Wednesday. That brought a pullback on Thursday but as I had warned in the article that afternoon, ‘I think we should still assume bullish control given the pace of the prior rally,’ and that showed in a big way on Friday as the pair extended its incline.
To be sure, the move is stretched, and RSI on the weekly is nearing its first overbought reading since August of 2020. And like I had shared previously, RSI on the daily is in rarified territory after hitting 75 for the first time since December of 2020. But that’s RSI – and it’s not a great timing indicator although it can help with context that may come into play. But I’ll parse through that below.
EUR/USD Weekly Price Chart
 Chart prepared by James Stanley, EUR/USD on Tradingview
EUR/USD Daily
The daily chart of EUR/USD is textbook. The symmetrical wedge built over a year as price narrowed tighter-and-tighter into a range. August opened the door for bulls who first pushed to trendline resistance, and then to a fresh high after a pullback to support at prior resistance of 1.0900.
That breakout then pulled back and, again, found support at prior resistance, around the Fibonacci levels from 1.0943-1.0960.
The next breakout surged to the fresh yearly high, followed by another pullback on Thursday that, again, found support at a key level, this time the psychological level of 1.1100. Bulls pushed forward for another high after the Powell speech at Jackson Hole and the pair is now nearing a test of the 1.1200 level and the 1.1275 Fibonacci level overhead.
EUR/USD Daily Price Chart
 Chart prepared by James Stanley, EUR/USD on Tradingview
EUR/USD Strategy
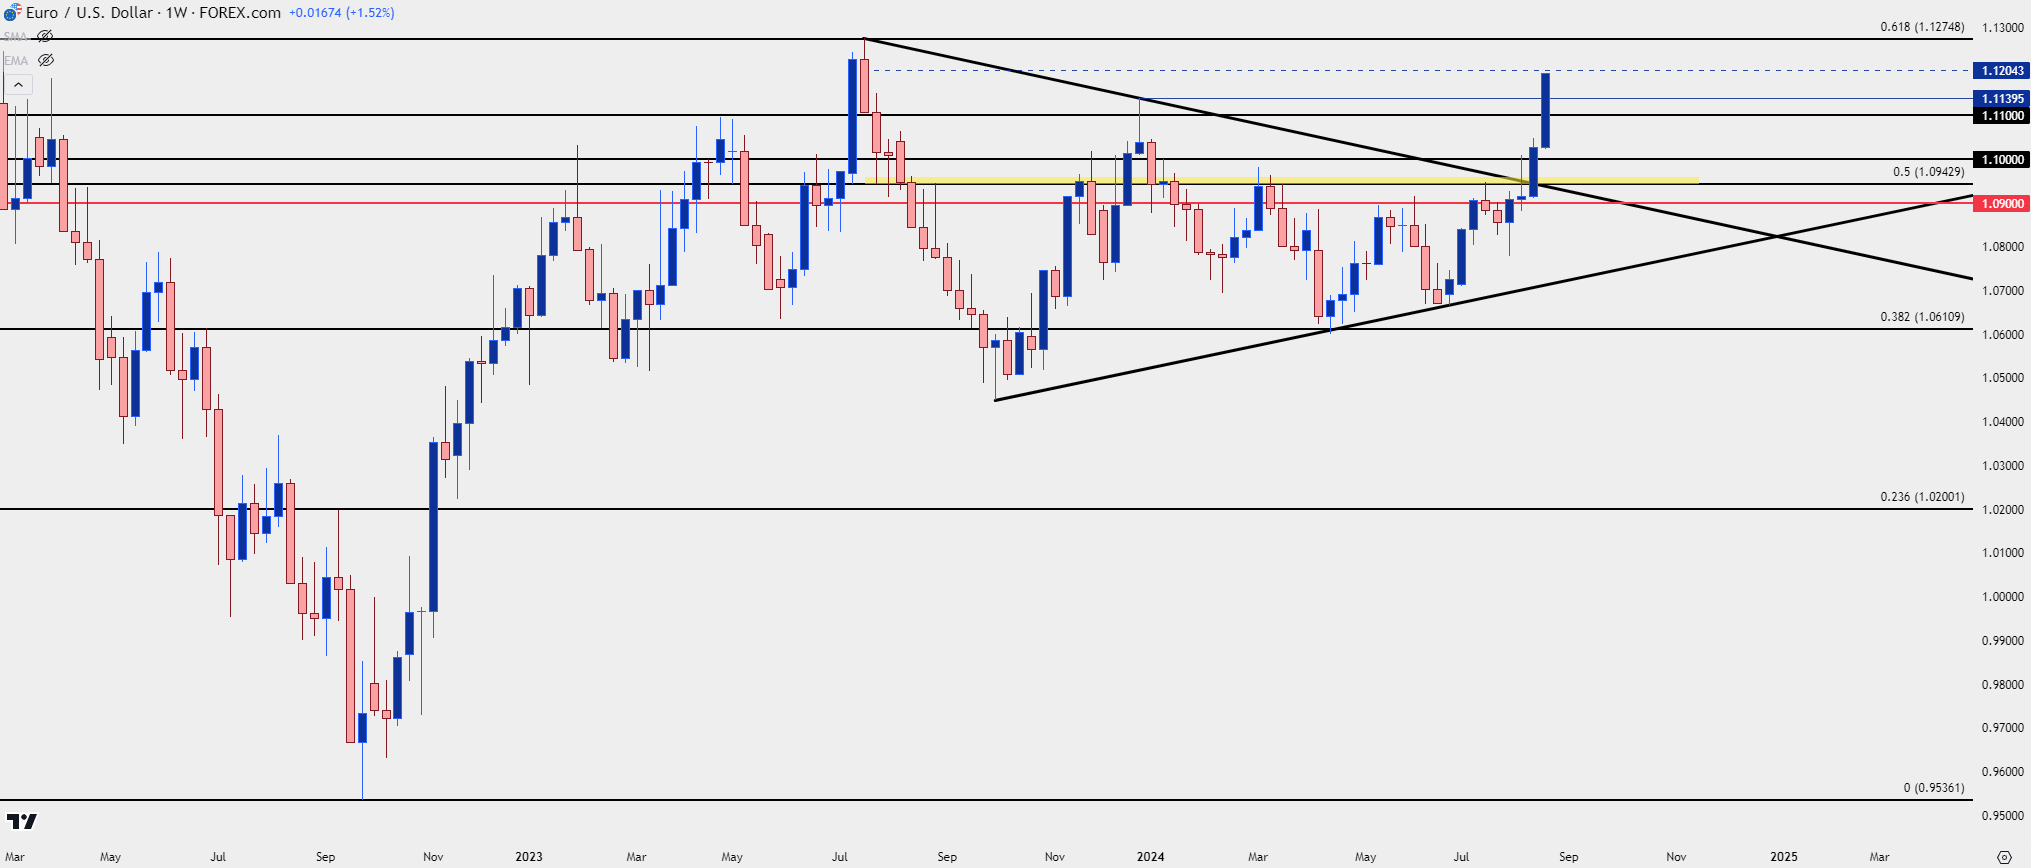
At this point EUR/USD is overbought on the daily chart and nearing overbought on the weekly chart. This makes chasing the pair-higher a difficult prospect but as I had shared on Thursday, we should still consider bulls to be in-control at this point. So, pullbacks can remain attractive and for inside price action, I’m tracking the 1.1140 level which was the swing-high in late-December. The 1.1100 level is below that and if sellers can push through, then the door may open to deeper bearish scenarios with focus on the 1.1000 psychological level which, notably, hasn’t shown much for support since the breakout a week ago.
For reversal scenarios: Both EUR/USD and USD are stretched and that can possibly lead to reversal setups. But this must be approached carefully at this point as there’s no evidence that bulls are yet done in EUR/USD or that bears are nearing finished in USD or DXY. The overbought and oversold nature of each market could soon lend itself to reversion themes, but more evidence would be necessary to establish that stance. In EUR/USD, the 1.1275 is of interest particularly if it can come into play quickly next week, as the market would be even more stretched and that was a level that led to a strong reversal last year. This is the 61.8% retracement of the 2021-2022 major move, and it’s related to the 38.2% retracement that has helped to mark the low for EUR/USD in 2024 trade.
EUR/USD Weekly Price Chart
 Chart prepared by James Stanley, EUR/USD on Tradingview
--- written by James Stanley, Senior Strategist


