
Euro talking points:
- EUR/JPY is trading at a fresh 14-year high as EUR/USD attempts to recover after visiting support at 1.0845 last Friday.
- In EUR/USD, the big question is whether the pair has already topped as USD-strength has remained; but EUR/JPY is a far different story as Yen-weakness has remained in a very big way.
- I’ll be discussing these themes in-depth in the weekly webinar on Tuesday at 1PM ET. It’s free for all to register: Click here to register.
It’s been a stark change of pace in EUR/USD over the past month. While questions have arisen around Europe’s economic recovery and the ability of the economy to withstand more hikes, the Japanese Yen has remained weak and that’s allowed for EUR/JPY to push up to a fresh 14-year-high to start the week.
Last week was deductively a positive for the Euro as there were multiple pieces of high impact data and none appeared to cause significant worry. The ZEW surveys in the early portion of last week remained weak but that was largely expected. And then the GDP print on Wednesday printed right at the expected 0.3% MoM and 0.6% YoY figures, followed by a similar showing in CPI on Friday when core came in right at the 5.5% expectation.
While that outlay of data wasn’t enough to collectively turn the tide, it did stem the bleeding, to a degree, as support showed in EUR/USD at the 1.0845 level on Friday morning and, so far, that’s held the low as price attempts to pull back to start this week. That 1.0845 level is key and this was a price that I had talked about in last Tuesday’s webinar as this was also the batch of support that held the lows in June.
That support inflection has allowed for price to begin pushing back into a zone of prior support, which now functions as resistance in the pair.
EUR/USD Daily Price Chart
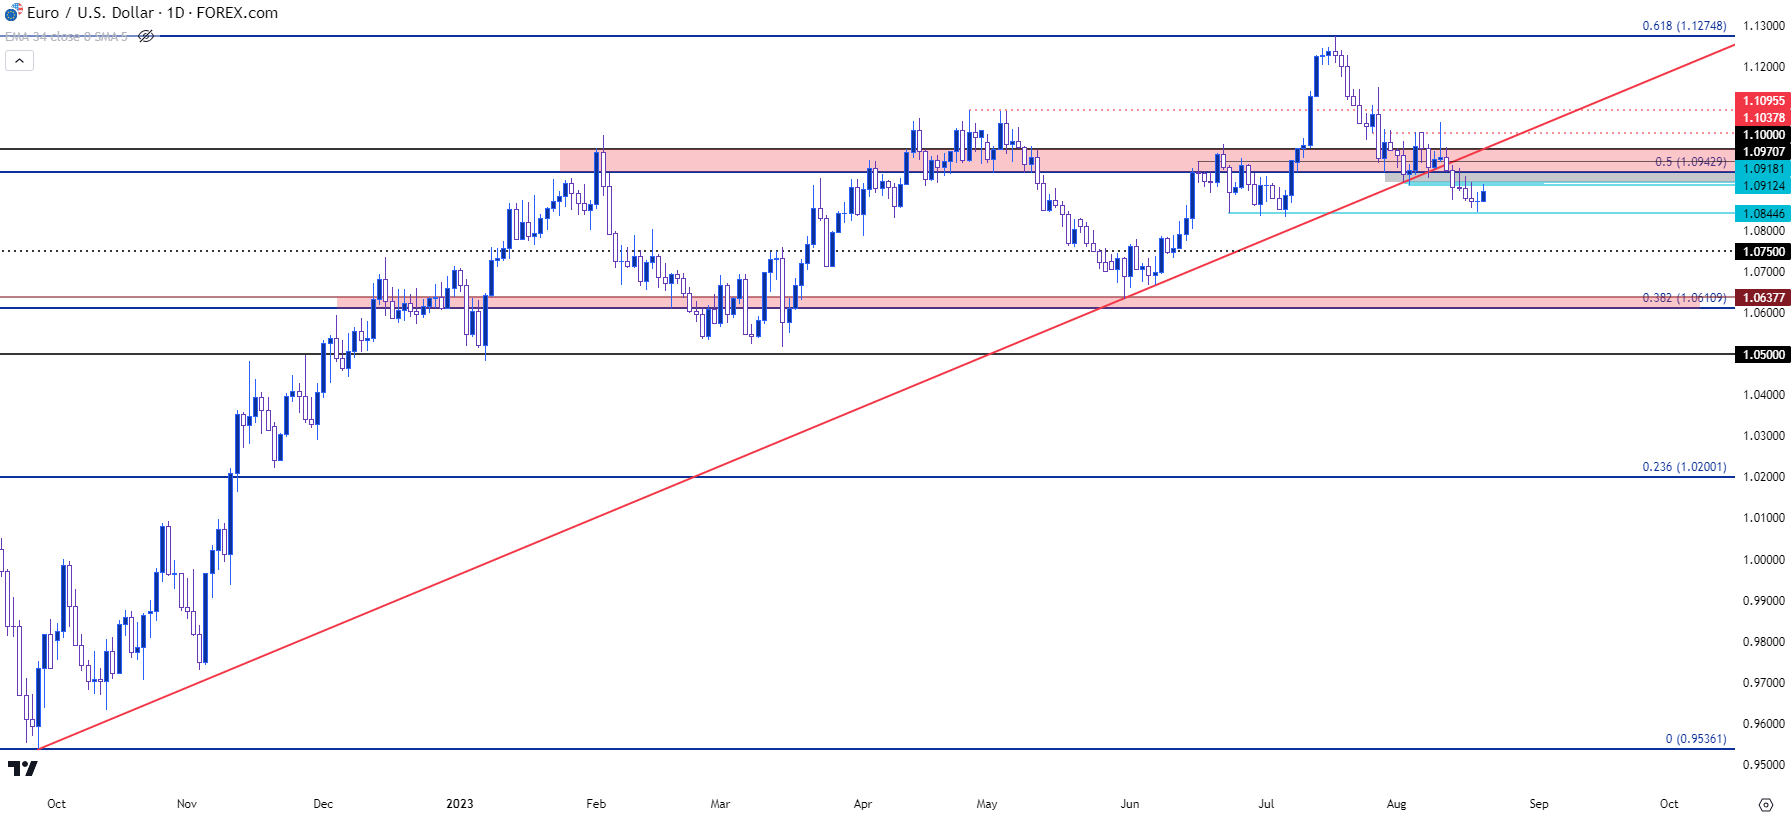
Chart prepared by James Stanley, EUR/USD on Tradingview
EUR/USD Prior Support, New Resistance
Taking a step back on EUR/USD offers some additional perspective, largely in the fact that price has spent most of this year in varying forms of consolidation. Bulls tried to rectify that in EUR/USD in July but failed to push past the 61.8% retracement of the 2021-2022 major move and that’s since held the high.
The pullback to the 1.1000 area was fast, but since then, it’s been a slow grind and on a longer-term basis this was an area of prior resistance that held for much of the first half of the year when price action was grinding in that consolidative state.
Given the continued push to lower-lows to go along with lower-highs, bears would still have some degree of control here but, from the weekly, we can see where bulls can quickly re-take the trend if they’re able to get price back above the 1.1064 level that set resistance two weeks ago. That would break the sequence of lower-lows and lower-highs and would put bulls back in control. Until then, the door is open for bears.
EUR/USD Weekly Price Chart
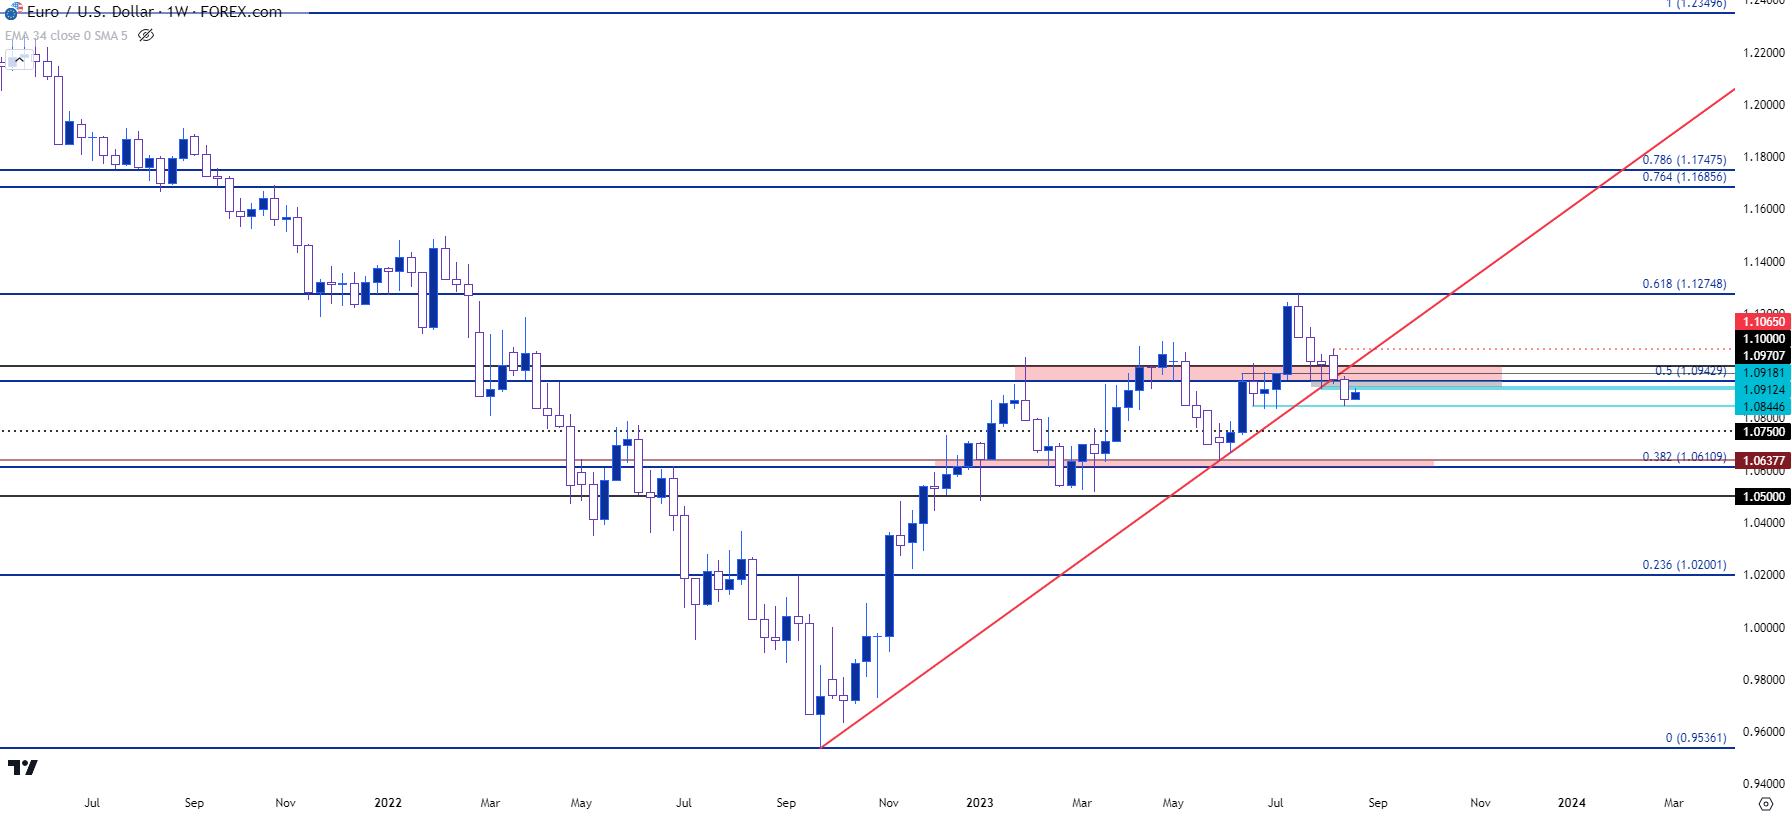
Chart prepared by James Stanley, EUR/USD on Tradingview
EUR/USD More Granular
Going back to the daily chart, we can see the importance of 1.0845 and this is a logical place to look for a bounce to develop. The bigger question now is whether sellers react after a bit of pullback and so far, resistance has held a short-term spot of prior support around the 1.0912 level.
But, bigger picture, it’s that same 1.0943 level that looms large as this is the 50% mark from the same major move that caught the high at the 61.8% Fibonacci level. Above that, 1.0970 remains an item of interest and then the 1.1000 level looms large. Each of these can function as lower-high resistance and where bears re-enter to hold the high will be key to gauging just how aggressive they remain to be.
EUR/USD Daily Price Chart
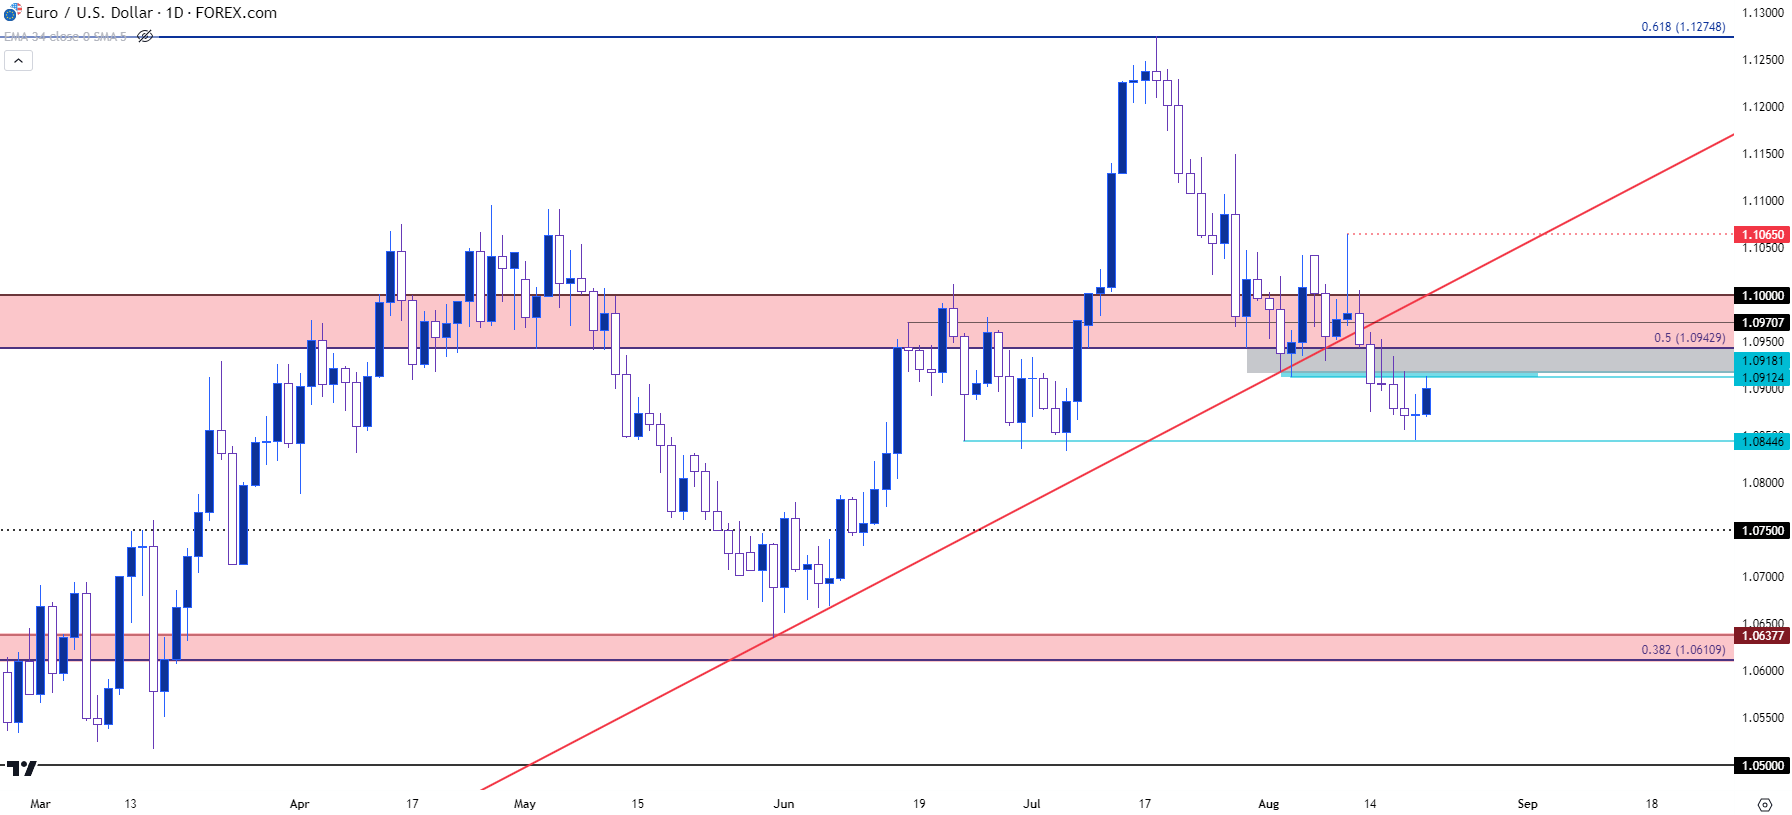
Chart prepared by James Stanley, EUR/USD on Tradingview
EUR/JPY
EUR/JPY is a far different picture than the above in EUR/USD. While USD strength has come back online over the past month, the Japanese Yen remains in a weak state as evidenced by the continued bullish push in USD/JPY.
In EUR/JPY, this morning marked another high point as the pair pushed up to another fresh 14-year high while making a move on the 160 psychological level that hasn’t been traded since August of 2008, before the world heard about the Lehman Brothers saga in the Financial Collapse.
EUR/JPY Monthly Price Chart
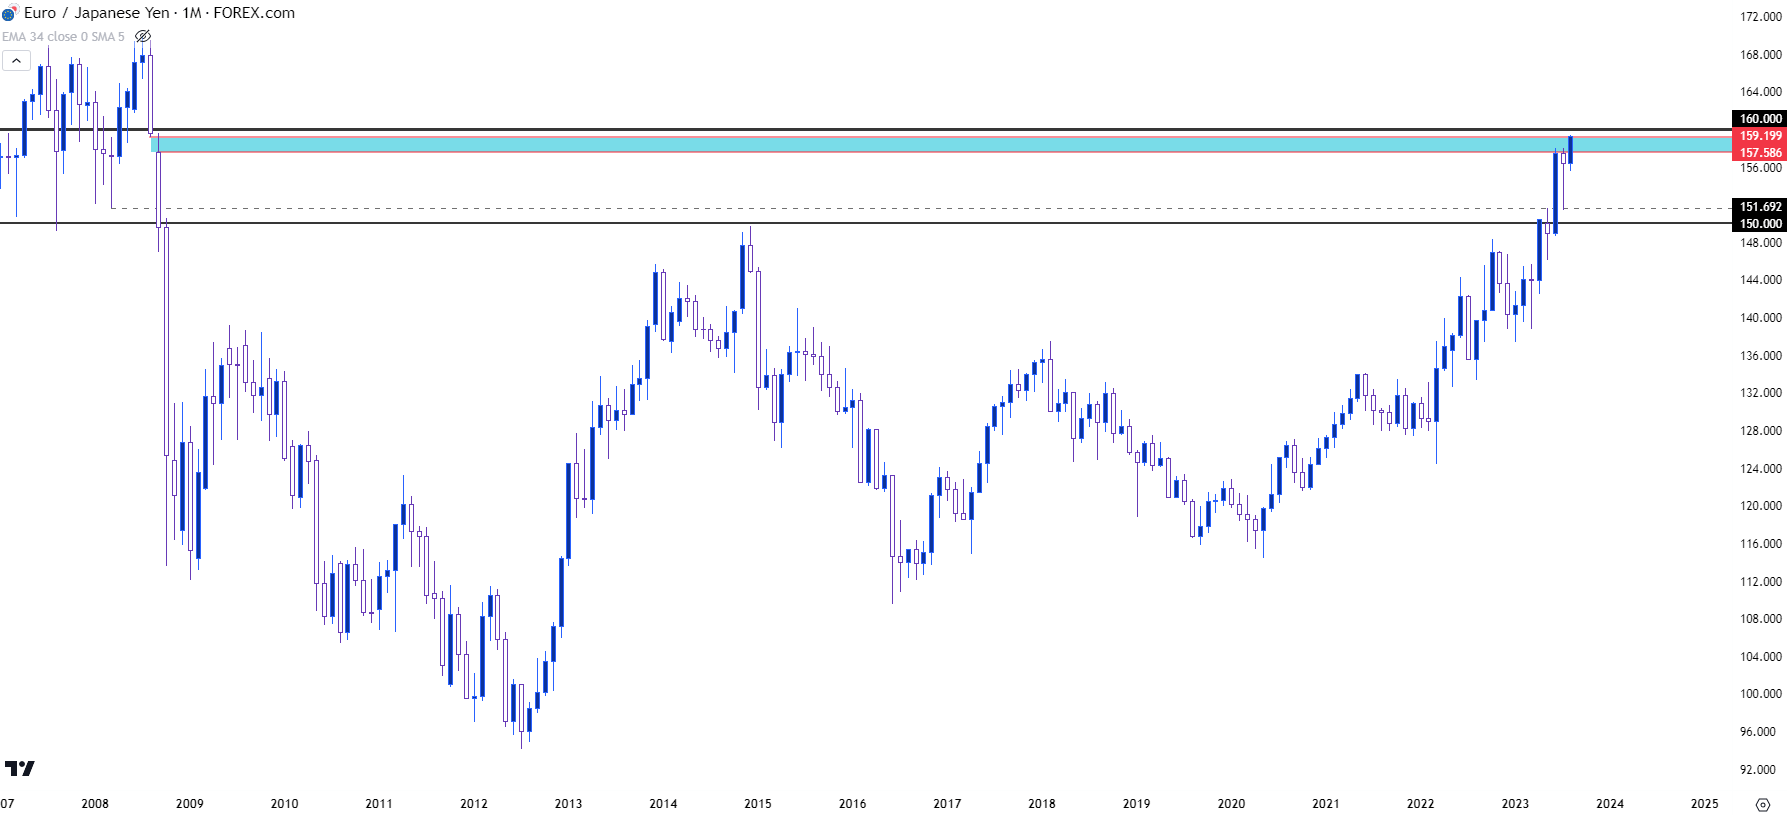
Chart prepared by James Stanley, EUR/JPY on Tradingview
EUR/JPY Continuation Potential
The natural question with a move of this nature is whether there’s continuation potential. The challenging part with answering that question is that it comes down to a very controllable factor and that’s whether the Ministry of Finance in Japan wants to threaten the possibility of intervention, and this is what brings USD/JPY back into the matter.
USD/JPY had started to stall last year around the 145 level on fears of possible intervention. The pair eventually moved up to 150 before the order from the Ministry of Finance was sent to the BoJ to intervene, which then sparked three months of pullback in that trend.
The difference now from when this scenario was in the headlines last September and October is the value of the Euro, which has recovered against the USD since the EUR/USD pair bottomed last September, so the dynamics amongst EUR/JPY and EUR/USD and USD/JPY are a bit different. But the concern around Yen intervention remains, and EUR/JPY sitting so close to the psychological level of 160 could make big picture continuation scenarios a bit more difficult to work with.
If the pair starts to show stall after a test above 160, the door can open for short-term fades. If any hints of intervention are floated out of Japan this week which will probably be a function of the move in USD/JPY, then that short-term fade could take on a longer-term, bigger picture connotation.
At this point, bulls are large and in-charge as they test a fresh high, but that 160 level is very nearby and a failure to produce drive above that price starts to open the door for reversal logic.
EUR/JPY Daily Price Chart
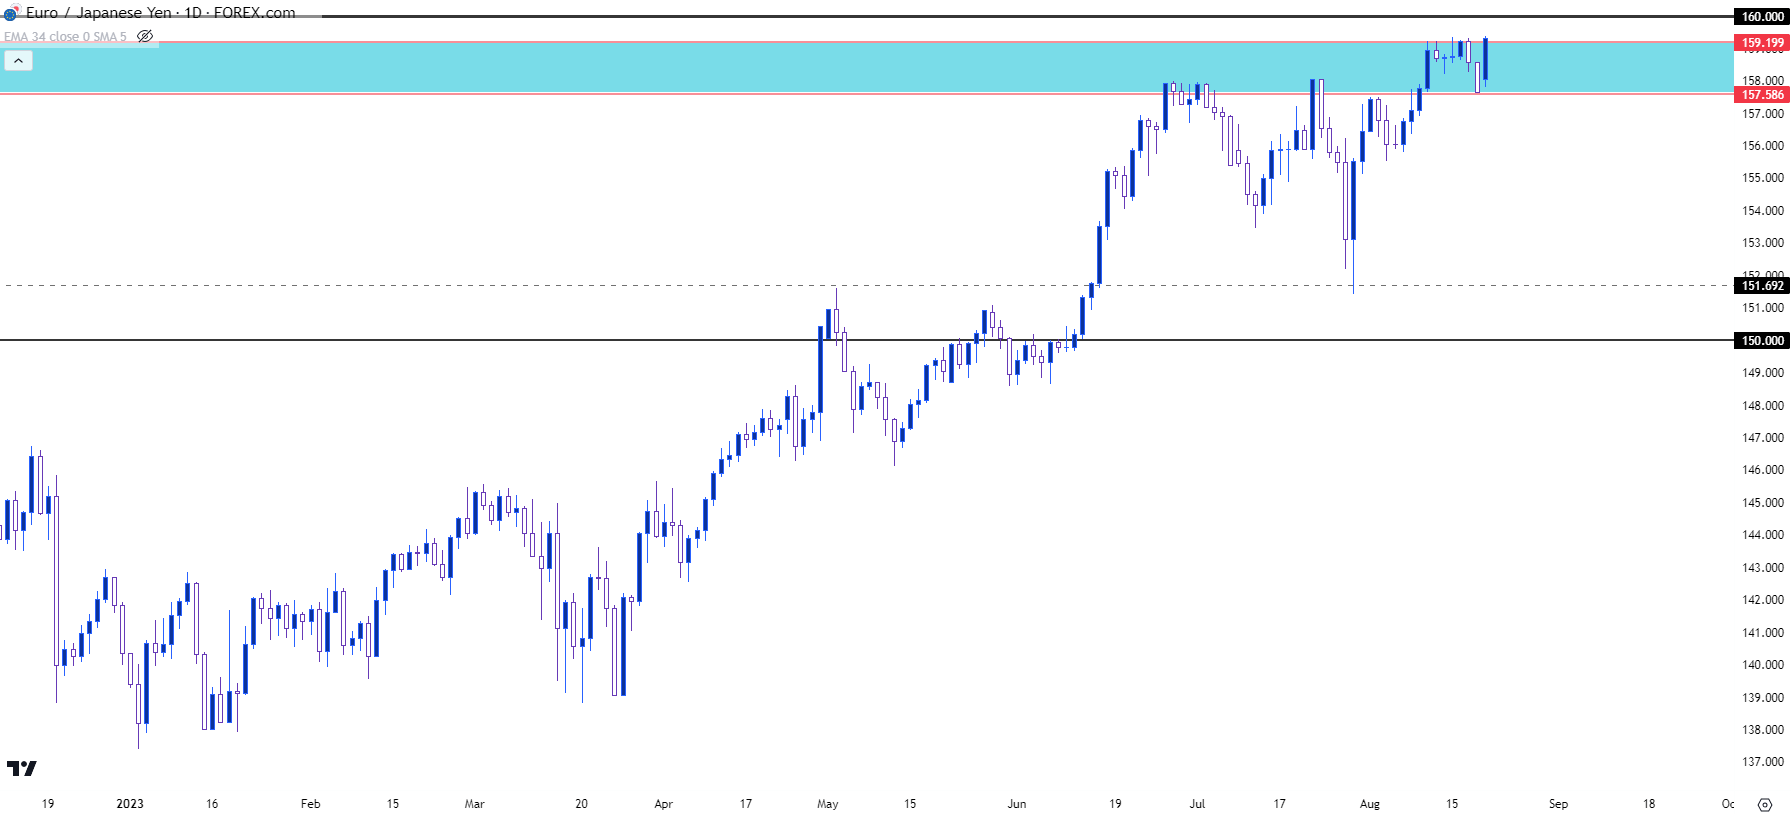
Chart prepared by James Stanley, EUR/JPY on Tradingview
--- written by James Stanley, Senior Strategist


