Euro, EUR/USD, EUR/JPY Talking Points:
- Thursday morning brings a European Central Bank rate decision, and the big question is whether the bank makes any hints towards future rate cuts.
- The US Dollar is testing above its 200-day moving average and EUR/USD is testing below its 200DMA. But with the ECB on Thursday, Core PCE on Friday and the FOMC next Wednesday, the big drivers remain on the horizon.
- EUR/JPY has held up a bit better so far in 2024 trade and there’s a big spot of possible support a little lower, around the 160.00 handle in the pair.
- I’ll be discussing these themes in-depth in the weekly webinar. It’s free for all to register: Click here to register.
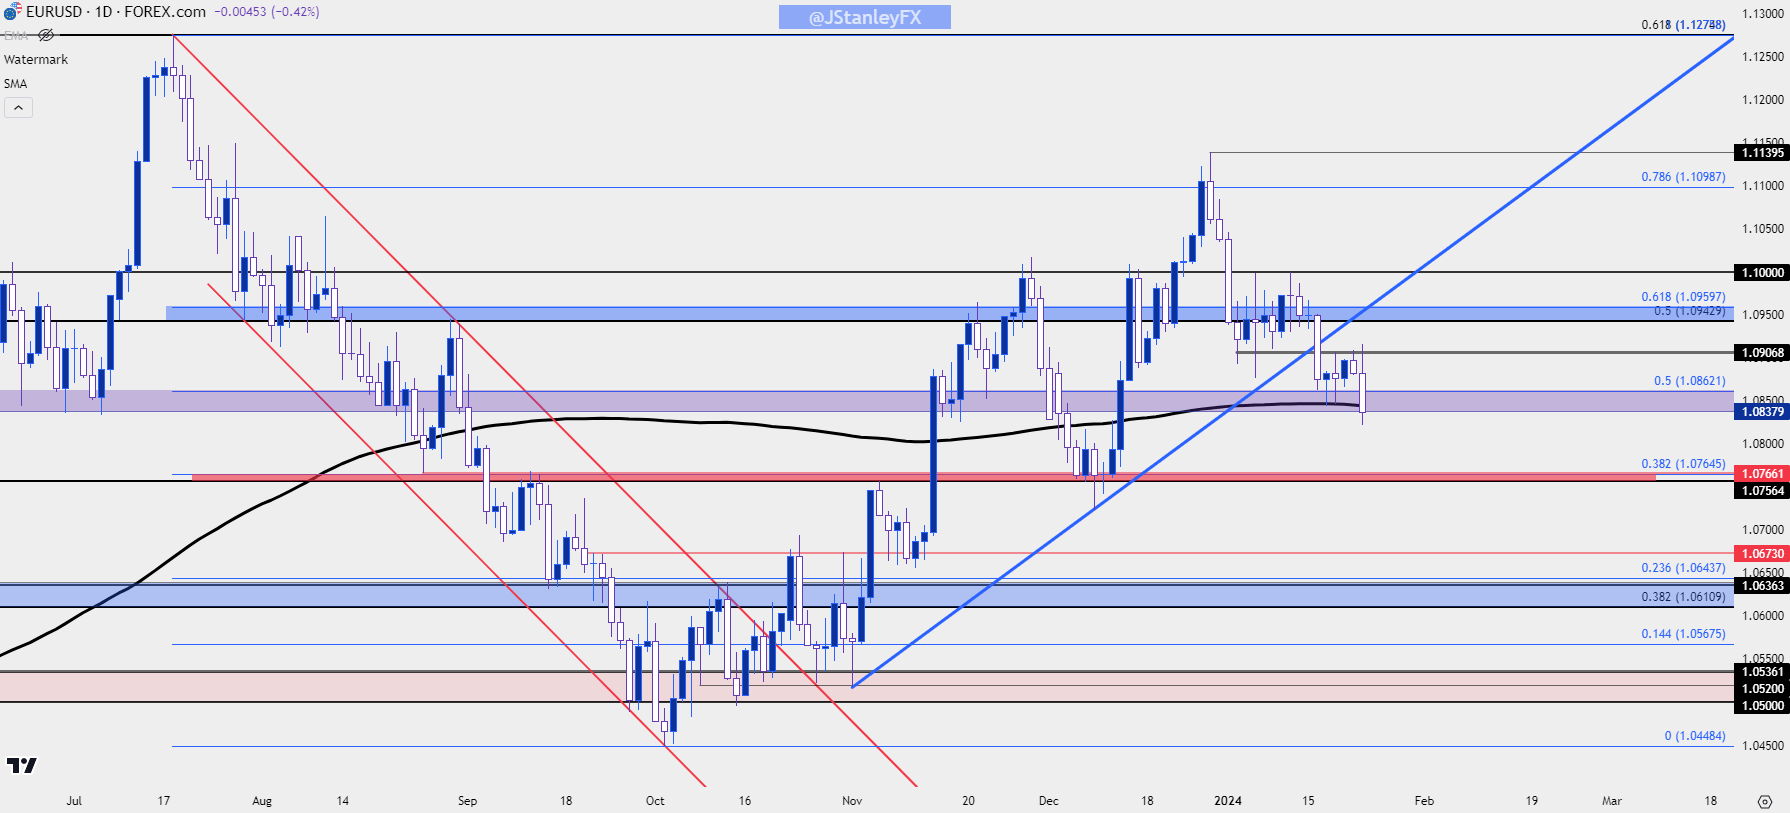
EUR/USD is working on a fresh 2024 low this morning with the pair testing below the 200-day moving average. Last week that indicator came in to help set the lows on Wednesday and Thursday. I had discussed this during the Wednesday webinar, highlighting the fact that support from the 200DMA could either help to establish the lows or provide a temporary pause point in the sell-off, at which point traders would want to read how bears responded to tests of lower-high resistance.
There were a few clear spots for that to take place: The 1.1000 level that held the highs the week prior would be the line in the sand that sellers would need to defend to keep the sequence of lower-lows and lower-highs alive, and there was a confluent zone of Fibonacci levels at 1.0943-1.0960. But – if sellers remained aggressive, they could jump in before that test and that would be a sign that bears didn’t want to wait. I had pointed out the area around a prior support swing, around the 1.0910 level that could illustrate that greater aggression from sellers.
So far that’s held the lower-high and sellers are pushing price back-below the 200-day moving average to continue the bearish sequence.
The daily close will remain important: If sellers can hold the daily close below the 200-day moving average that could provide greater scope for bears, with the next spot of support around 1.0766, which is the 38.2% retracement of the same Fibonacci sequence that’s offered levels at 1.0960 (the 61.8%) and 1.0862 (the 50% mark).
EUR/USD Daily Price Chart
 Chart prepared by James Stanley, EUR/USD on Tradingview
The ECB
Thursday brings the European Central Bank’s first rate meeting of the year, and in my opinion, I think we’ll see the ECB cut before the Fed this year. That was a running theme from July through October of last year, but it was around the November FOMC rate decision that this began to shift, as Chair Powell started to take a very dovish tone to markets and US rate cuts began to get priced-in more aggressively. The December 13th FOMC meeting extended this push with Powell sounding even more dovish, and that helped to create a spike move in EUR/USD with a late-2023 high at 1.1140.
To this point, Christine Lagarde has avoided the topic of rate cuts, saying that the bank hasn’t even started the discussion. Powell and the FOMC, on the other hand, have openly admitted that they have, and this helps to provide some color on the deviation between rate expectations in the two economies. At this point, some rate cuts have started to get priced-out in the US, with probability of a move in March now below the 50% mark.
At the December ECB meeting Lagarde pushed back on the idea of rate cuts in March, using the phrase ‘we should not lower our guard.’ That was just one day after Jerome Powell very much sounded like he was lowering his guard, remarking that the conversation around rate cuts in 2024 had already begun. But the ECB did cut inflation forecasts which could be a lead-in to faster rate cuts.
The net response from the FOMC and ECB rate decisions on December 13th and 14th was a strong move in EUR/USD, pushing above the 1.0862 Fibonacci level on the way to a 1.1000 re-test later that week. The pullback from 1.1000 was quickly and aggressively bid, and two weeks later EUR/USD had crafted a fresh five-month-high. After that high was set on December 28th, it’s been a different theme, however, with lower-lows and lower-highs coming into the picture.
So the big question for Thursday’s meeting is whether Lagarde can hold the line on the topic of rate cuts and, if she can, there could be an excuse for a boost in the Euro; but whether that’s another short-term bounce into a lower-high or the start of a fresh trend, we’ll likely need to wait for the Core PCE release out of the U.S. on Friday, or the FOMC rate decision on the following Wednesday to find out with certainty. Inflation remains a large push point for the US economy and expectations for rate cuts do remain aggressive, with as many as five 25 bp cuts priced-in for the rest of the year.
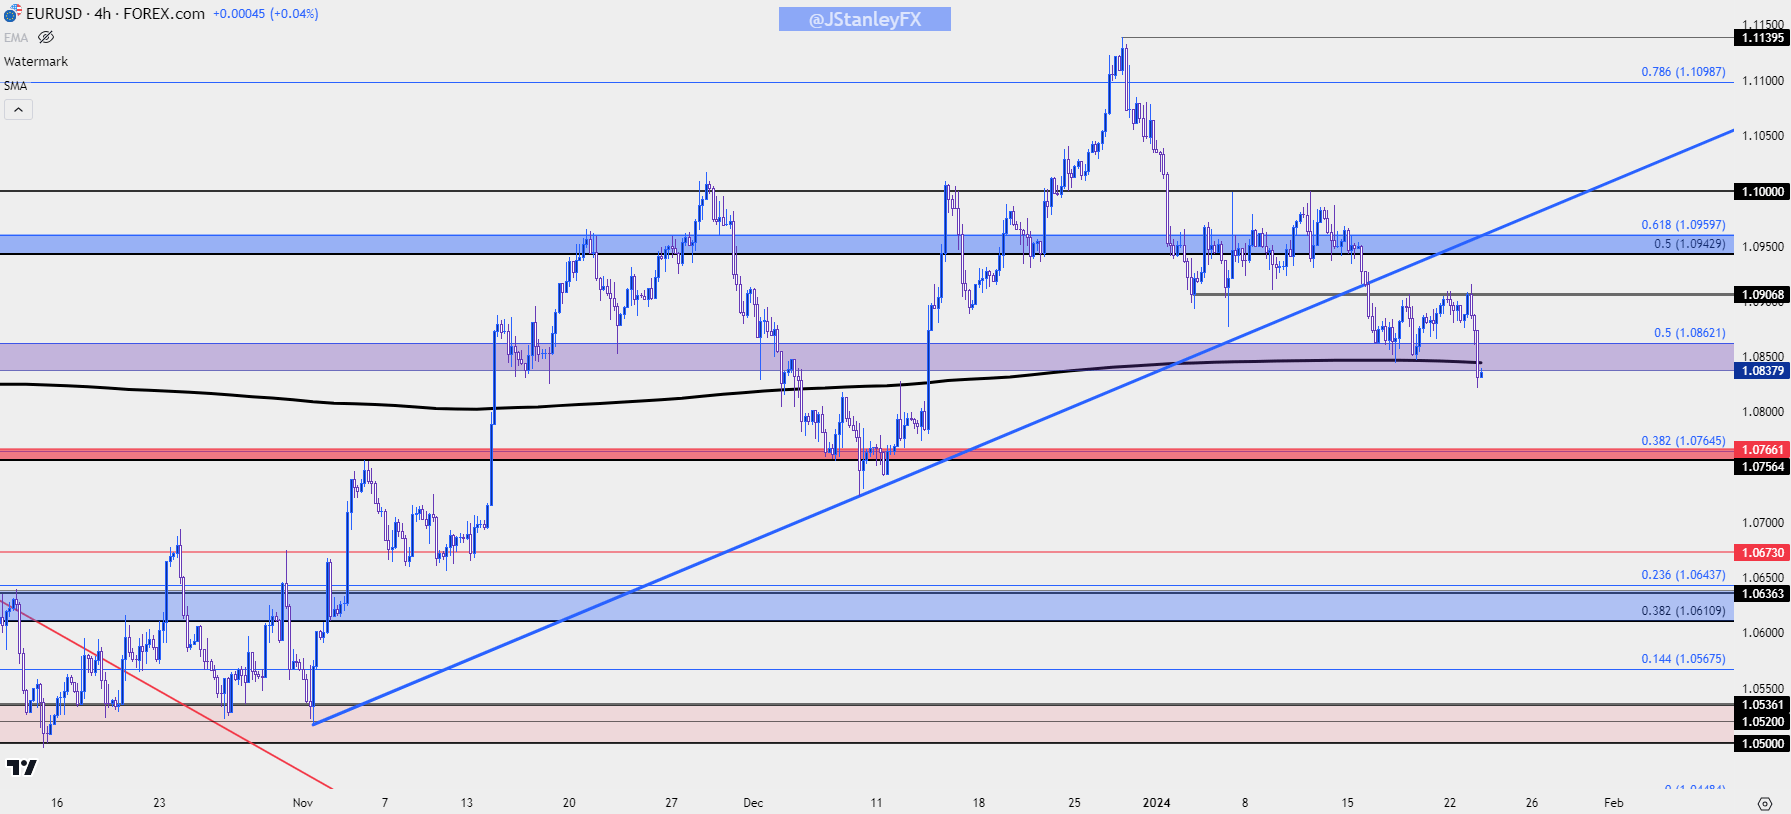
From the daily chart below, we can get a better view of near-term structure. The 1.0910 area has so far held three different tests of resistance, allowing for a push down to a lower-low and a test below the 200-day. If sellers remain aggressive, there could be a case for short-term resistance at 1.0862; and the next item of support would be around the 1.0766 that held the lows in early-December, just ahead of the FOMC/ECB outlays.
Below 1.0750/1.0766, there’s another confluent zone that runs from Fibonacci levels at 1.0611 up to 1.0643, and that’s followed by a spot that played a large role as support last year running from 1.0500 up to 1.0536.
EUR/USD Four-Hour Price Chart
 Chart prepared by James Stanley, EUR/USD on Tradingview
EUR/JPY
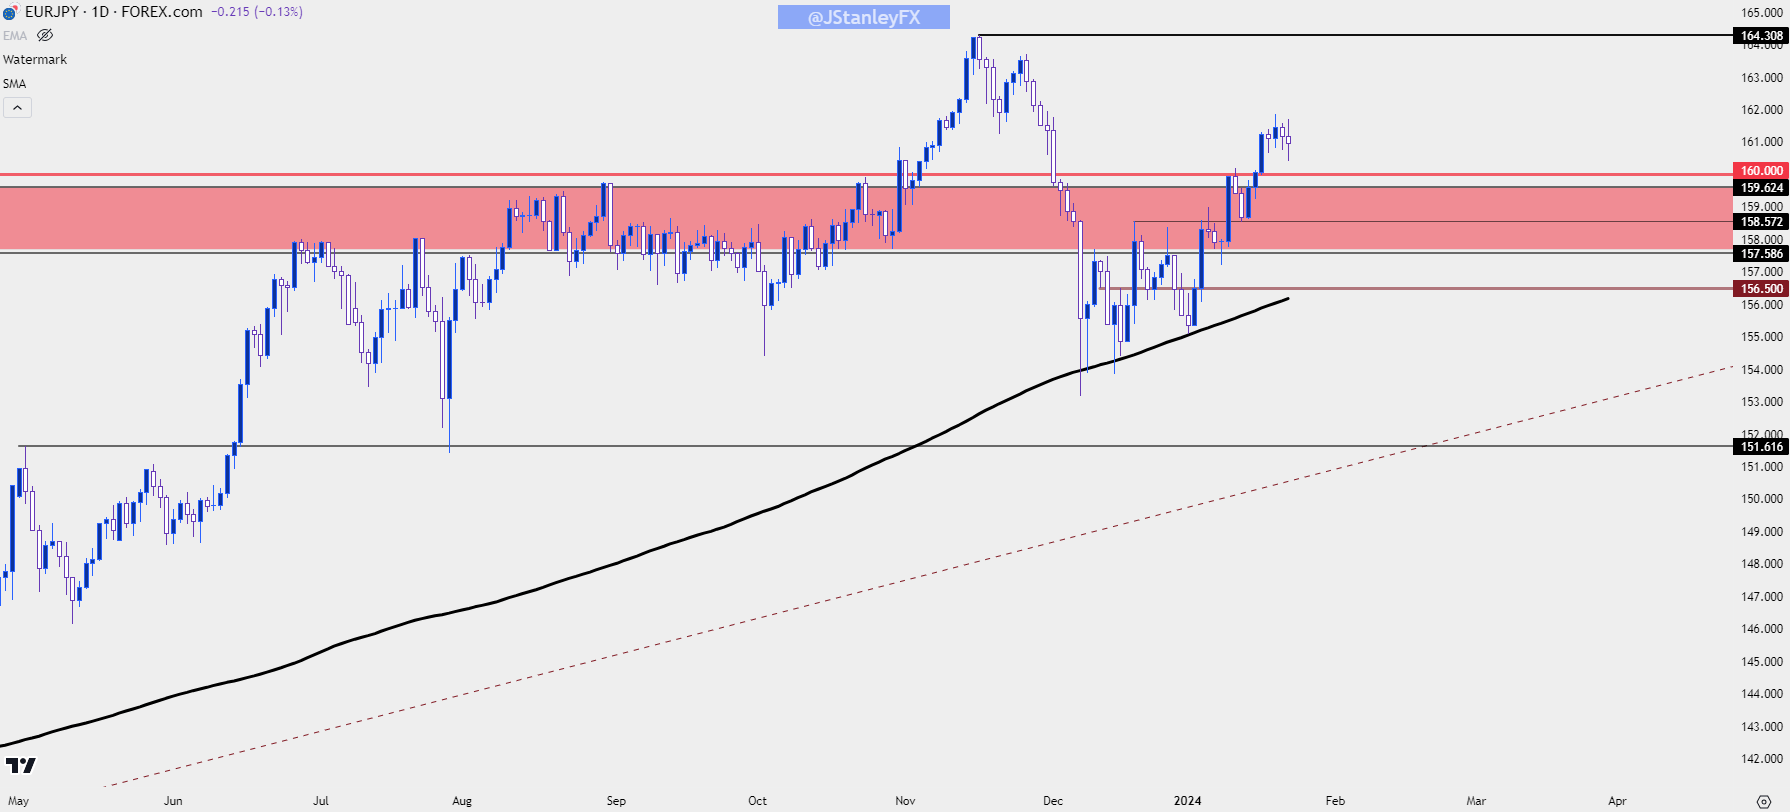
EUR/JPY remains very near the fresh 15-year highs that posted in November. And there’s been quite a bit going on since then, namely a run of strength in the Yen that’s largely been priced-out.
It was the 200-day moving average that came into hold the lows over a four-week span, and as the door opened into 2024 trade the pair launched-higher, pushing back above the 160.00 level and continued to drive into last Friday, with the pair setting a fresh monthly high.
For those that are looking for Euro-strength, a case can be made in EUR/JPY as there’s been a continuation of higher-highs and lows over the past few weeks, and there’s a large line-in-the-sand that the pair remains above at the psychological level of 160.00. A pullback combined with a show of support around that level could keep the door open for bullish continuation scenarios.
Below that, there’s a prior swing of resistance-turned-support at 158.57, and that’s followed by 157.59. If bulls fail to hold price above that zone then there could be larger reversal themes brewing, and at that point the big question would be whether EUR/JPY is a better candidate for a continuation of Euro-weakness than EUR/USD.
EUR/JPY Daily Chart
 Chart prepared by James Stanley, EUR/JPY on Tradingview
--- written by James Stanley, Senior Strategist


