Asian Indices:
- Australia's ASX 200 index fell by -22.9 points (-0.31%) and currently trades at 7,302.40
- Japan's Nikkei 225 index has risen by 4.56 points (0.01%) and currently trades at 32,197.31
- Hong Kong's Hang Seng index has fallen by -59.79 points (-0.31%) and currently trades at 19,479.67
- China's A50 Index has fallen by -100.18 points (-0.75%) and currently trades at 13,178.66
UK and Europe:
- UK's FTSE 100 futures are currently down -34.5 points (-0.46%), the cash market is currently estimated to open at 7,529.87
- Euro STOXX 50 futures are currently down -14 points (-0.32%), the cash market is currently estimated to open at 4,318.91
- Germany's DAX futures are currently down -56 points (-0.35%), the cash market is currently estimated to open at 15,895.86
US Futures:
- DJI futures are currently up 107 points (0.3%)
- S&P 500 futures are currently up 18.75 points (0.42%)
- Nasdaq 100 futures are currently up 87.5 points (0.57%)

- The Bank of Japan’s minutes (or “Summary of Opinions”) once again tried to pour cold water on any hopes of a rate hike by saying “there is still a significantly long way to go before revising the negative interest rate policy
- However, members also discussed the prospects of elevated inflation which suggests they may be inching towards policy normalisation
- Australia has called for China to remove all trade restrictions, after Chia announced on Friday that it had lifted tariffs on Barley imports that had been in place for three years due to “changes in the Chinese market”.

- EUR/GBP has been grinding its way higher, in line with our bullish bias. The 1-hour chart is coiling up to suggest we could be approaching a burst of volatility, but currently consolidating beneath the June 22nd high of 0.8636
- The DAX formed a bullish pinbar formed on Friday which is also a bullish outside candle relative to Thursday’s Doji. A break above 16,000 opens up a run for gap resistance at 16,240.
- The FTSE 100 formed a small bullish candle on Friday, following Thursday’s large bullish hammer. The 200-day EMA is hovering overhead, so we’d want to see a break above 7573 before assuming the bullish hammer has been confirmed as a swing low.
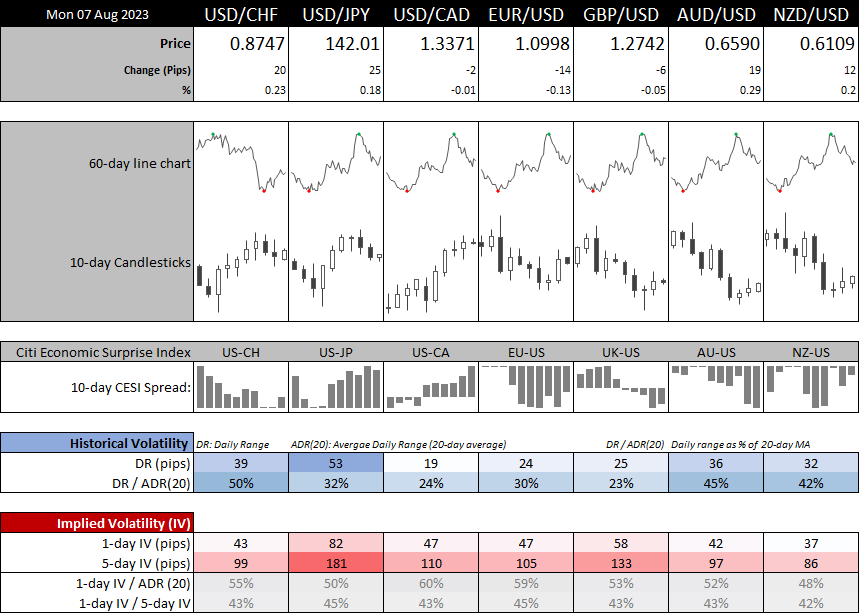
- USD/CHF has drifted higher overnight, but stalled just beneath the 2021 low of 0.8758. An important swing high may have formed on Wednesday around 0.8800, so we’re looking for another leg lower whilst prices remain beneath last week’s high.
- WTI crude oil made a marginal high during Asian trade, but all eyes are on how it react around the April / YTD high of 85.53. Given the significance of the level, a consolidation or retracement lower could be on the cards, although the bias is for an eventual break higher.
- Gold prices made a mild attempt to retest Friday’s high but prices are now pulling back. We highlighted 1935 as a potential level of support which could aid with bullish setups, for an anticipated run towards 1955.
EUR/USD 1-hour chart:
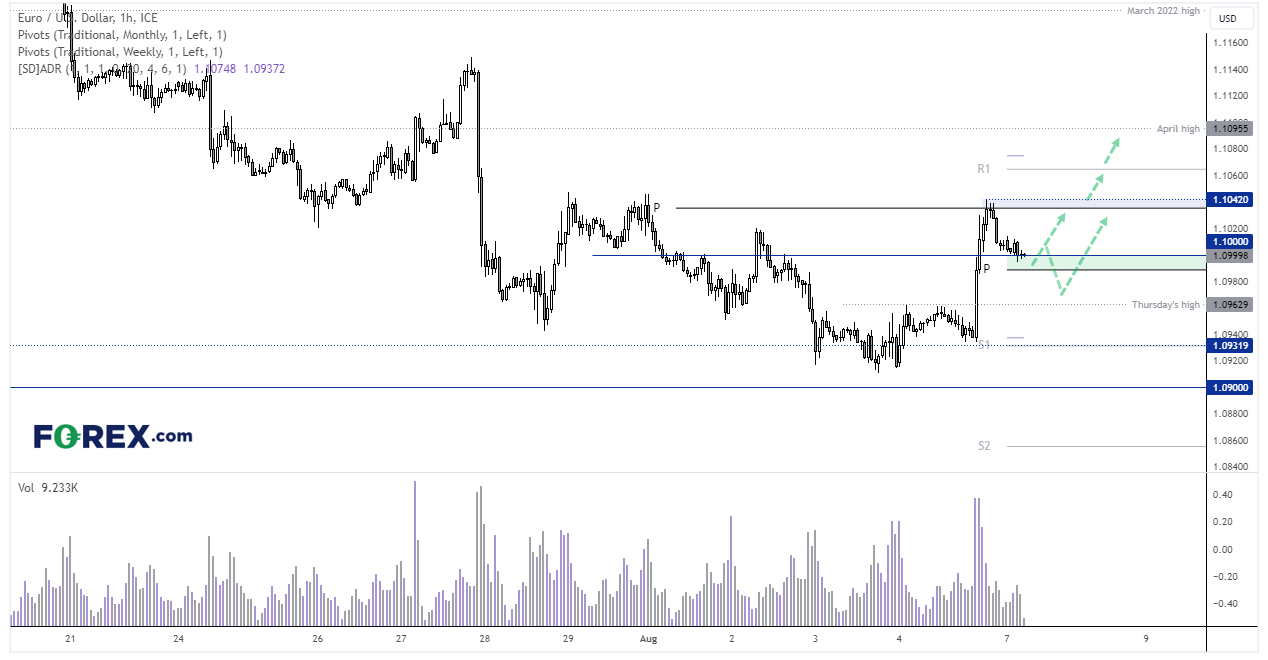
EUR/USD rose to a 2-day high on Friday following the soft job growth print for NFP. It seems the low I was pondering on Friday ahead of the NFP report has come to fruition, to the bias is to seek bullish setups on lower timeframes if or when they materialise through the week.
Prices have pulled back slightly during Asian trade, and flirting with a break of 1.10. Given the strong rally on Friday, I wouldn’t be too surprised to see prices try and fill some of the likely volume gaps made with a break above Thursday’s high, which leaves the potential for a spike or two after European open. Ultimately, any apparent swing low that forms above or around Thursday’s high could appeal to bullish swing traders, and we’re looking for an initial move to Friday’s highs (a break above which brings the weekly R1 pivot and the April high into focus.

USD/JPY 1-hour chart:
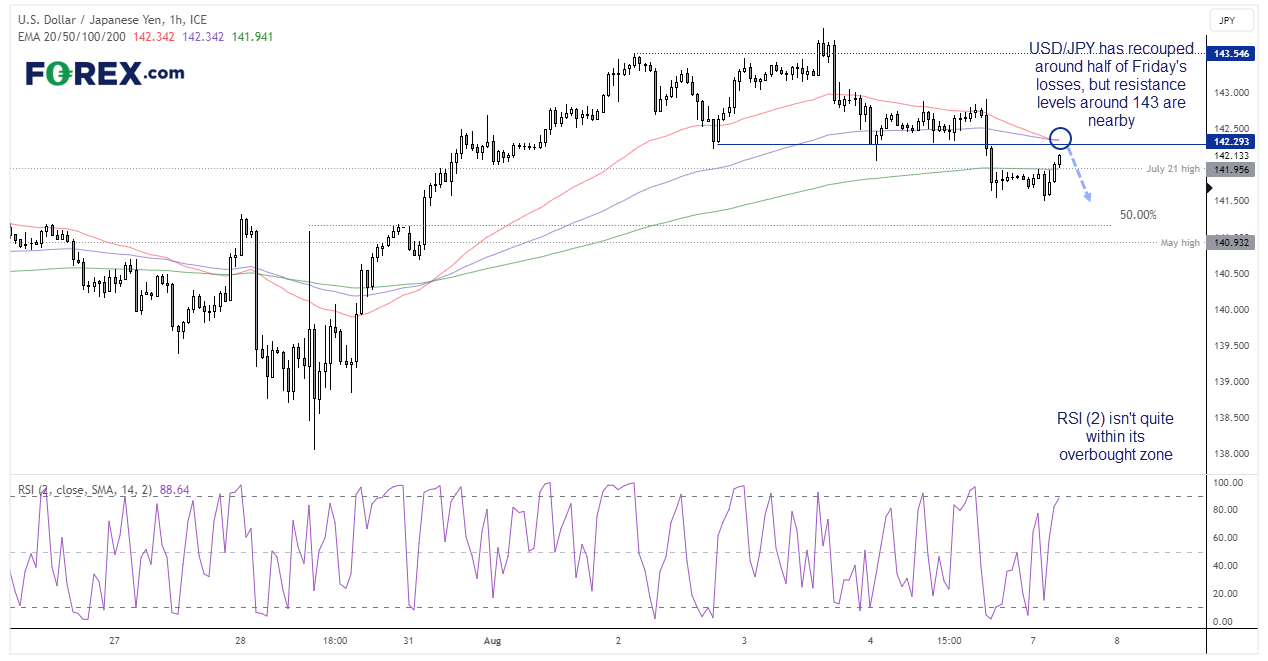
USD/JPY has recouped around half of Friday’s losses after an early false-break of Friday’s low, in what appears to be technical repositioning. We can see on the 1-hour chart that prices are now above the New York PM session range and above the 200-hour EMA. Perhaps it can extend its rally towards the 142.29 lows, 143 handle or the 100/50-bar EMA around 142.35, at which point we’d prefer to seek evidence of a swing high. We can also use RSI (2) to monitor its potential for a swing high and wait for it to either go above 90 or seek a bearish divergence.

View the full economic calendar
-- Written by Matt Simpson
Follow Matt on Twitter @cLeverEdge


