
EUR/USD Talking Points:
- EUR/USD is on the verge of fresh 19-month lows after an earlier rally has been soundly reversed.
- The 1.1000 level has so far functioned more as resistance than support, and the big question into the end of the week is whether profit taking or short covering can push prices back above the big figure.
US Dollar strength continues to run and this is on full display in EUR/USD, which is sitting very close to fresh 19-month lows. For reference, there is another key support level sitting just a bit lower, as 1.0943 is the 50% mark of the 2021-2022 major move, and the Fibonacci retracement produced by that trend has shown a number of important inflections.
The 61.8% mark held the highs just a few weeks ago, and that also held the yearly high back in 2023. The 23.6% mark held the lows after the sell-off from that 61.8% level, and that’s what led to the strong rally in the pair in 2024. And then over the summer, it was the 76.4% retracement that held a lower high before, ultimately, sellers started to take over in a move that last to this day.
EUR/USD Weekly Price Chart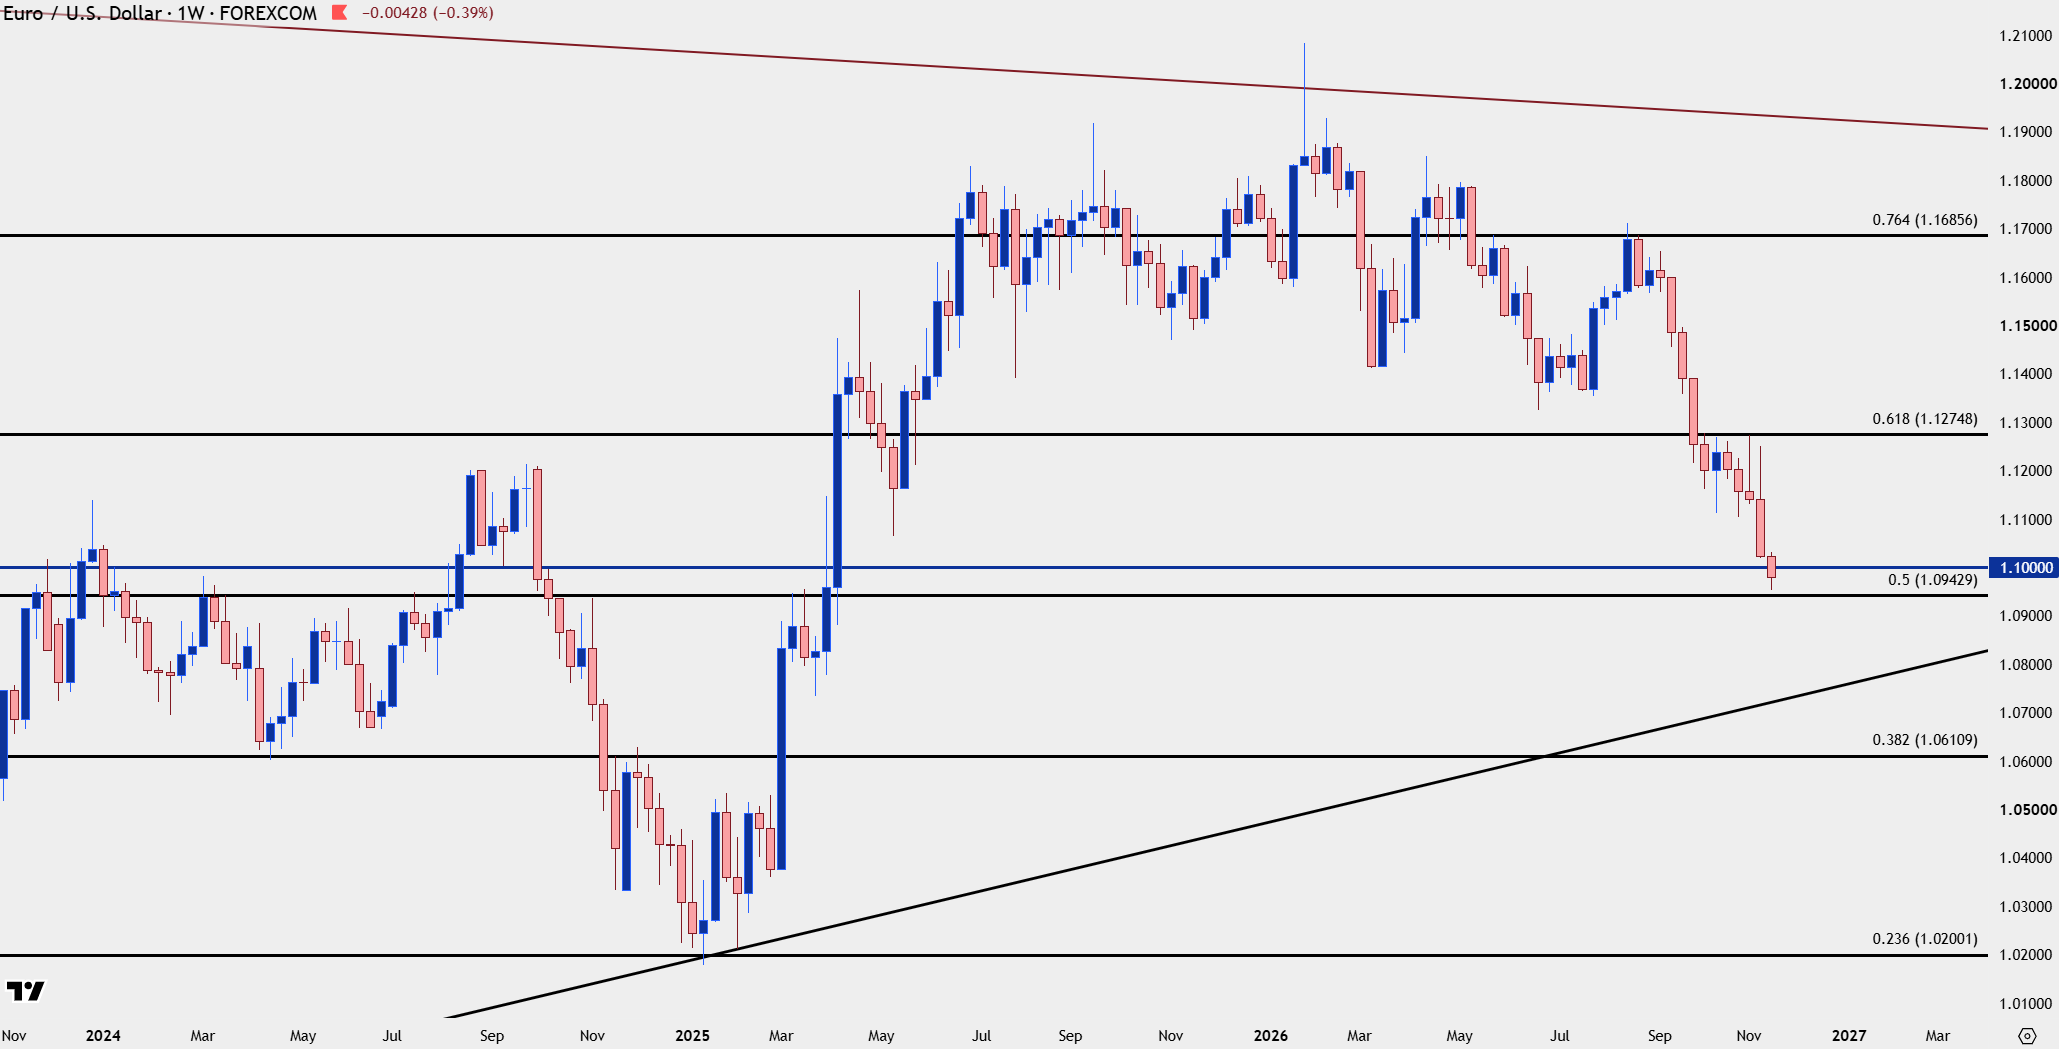
Chart prepared by James Stanley; data derived from Tradingview
EUR/USD Sell-Off Slowing Around 1.1000 but Bears Remain Persistent
Often with a major pair such as EUR/USD a major psychological level like 1.1000 can take time to break. There’s, of course, the psychological element where prices below 1.1000 feel cheaper than prices above, and this can lead to some bullish activity as buyers come in for a perceived value. But there’s also the usability element where larger market players such as multinational corporations or central banks or pension funds that have obligations in both currencies will respond to these more noticeable levels.
This is why a level like 1.2000 can reverse a rally, similar to what showed back in January, and this is why a price like 1.1500 can stall sellers for months, although it may not seem as noticeable on shorter-term charts.
So far sellers have continued to push with prices below 1.1000 and that in and of itself can be saying something, as the world adjusts to a more hawkish Fed that seems to be prioritizing inflation more than they have over the past 18 years since the Financial Collapse.
EUR/USD Daily Chart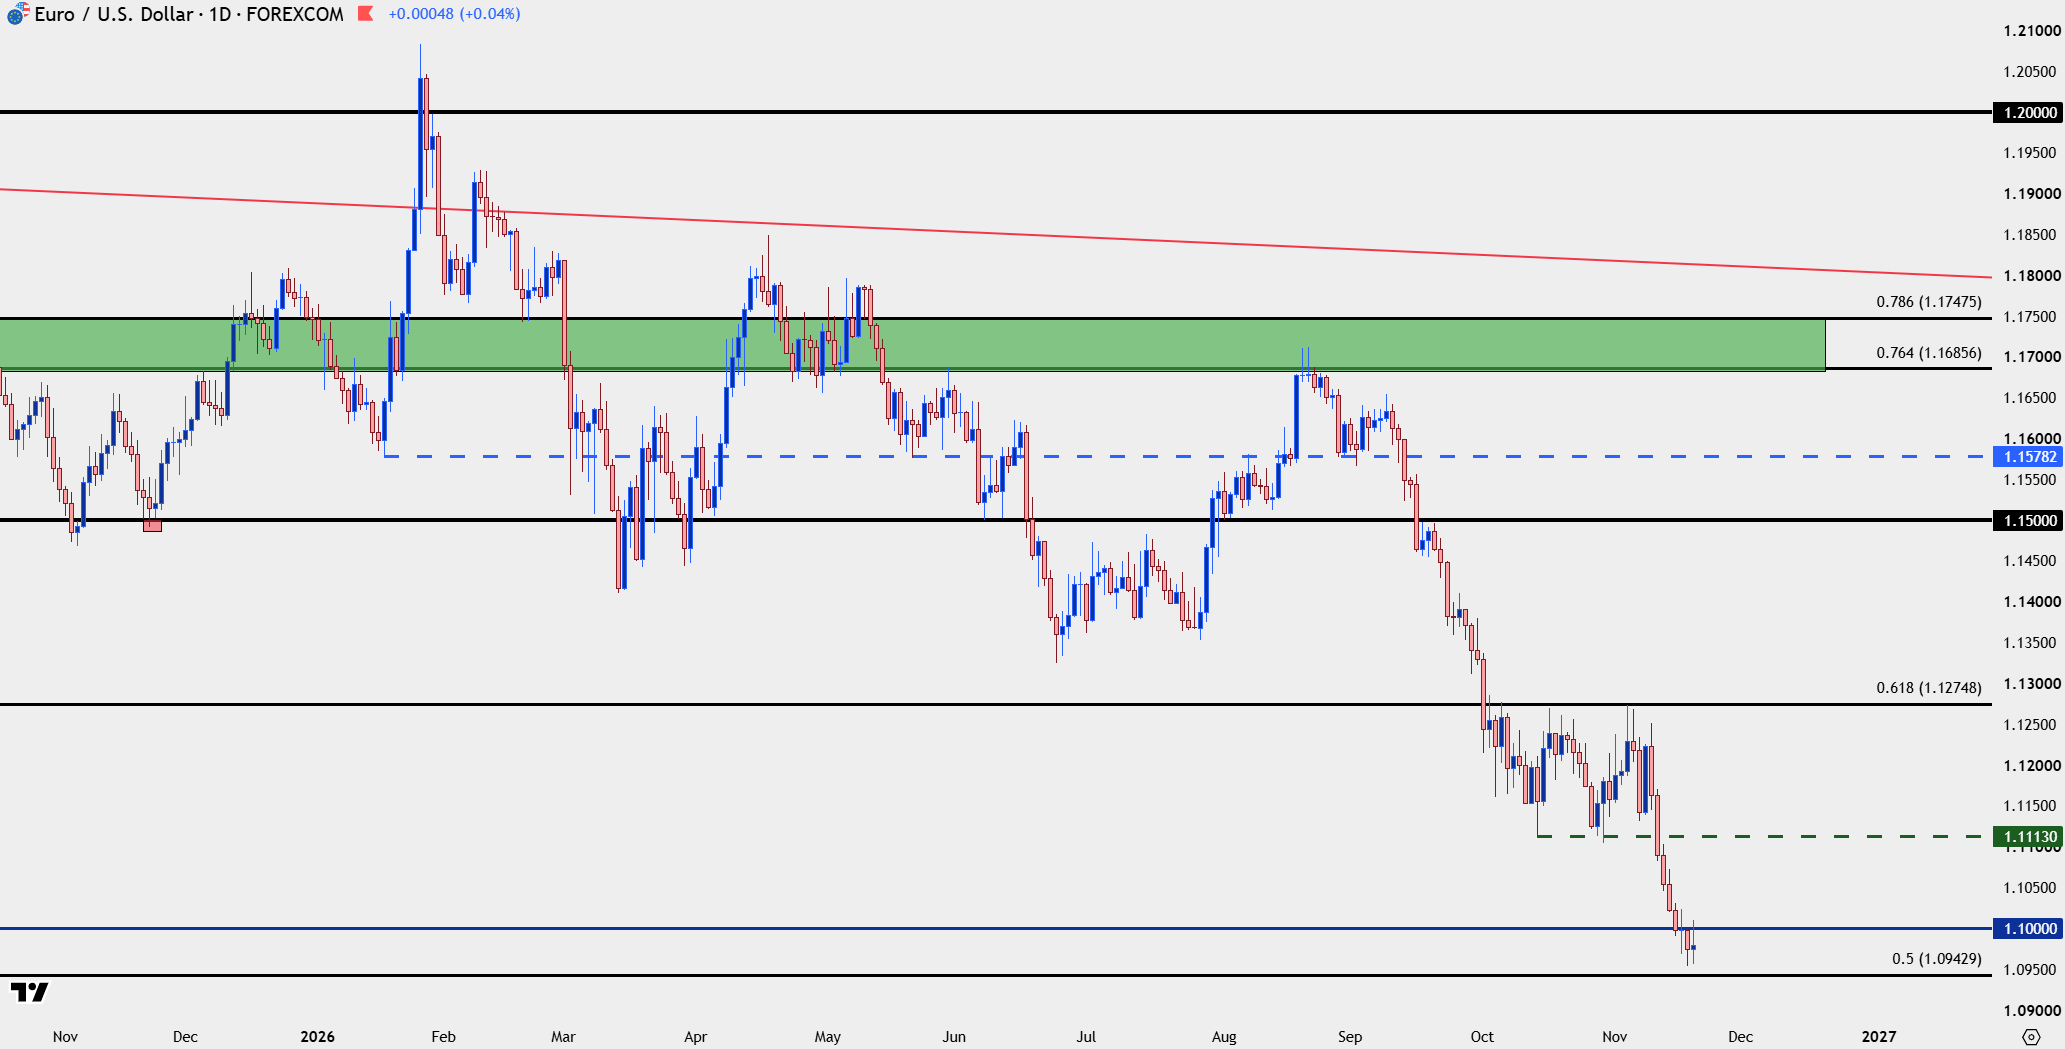
Chart prepared by James Stanley; data derived from Tradingview
EUR/USD: Watch the Weekly Close
This has been a centerpiece of the past two webinars, highlighting the importance of weekly bars. As we can see from the daily above, the sell-off below 1.1000 has so far slowed, even though bears are persistently jumping on rallies.
But if the weekly closes above the 1.1000 level there’s an open door for a pullback, driven by short covering in a market that’s become increasingly unbalanced as the sell-off has only continued to gain steam.
For levels – The 1.1113 level stands out as a spot of possible resistance as this showed as support multiple times before the 1.1000 test took place. Above that, the same 1.1275 Fibonacci level referenced above stands out, as a break above that will signal a larger move of bullish control and, conversely, a breakdown move in the USD.
And more nearby for more aggressive strategies, there’s a swing of support turned resistance around 1.1071 that shows as attractive.
EUR/USD Four-Hour Chart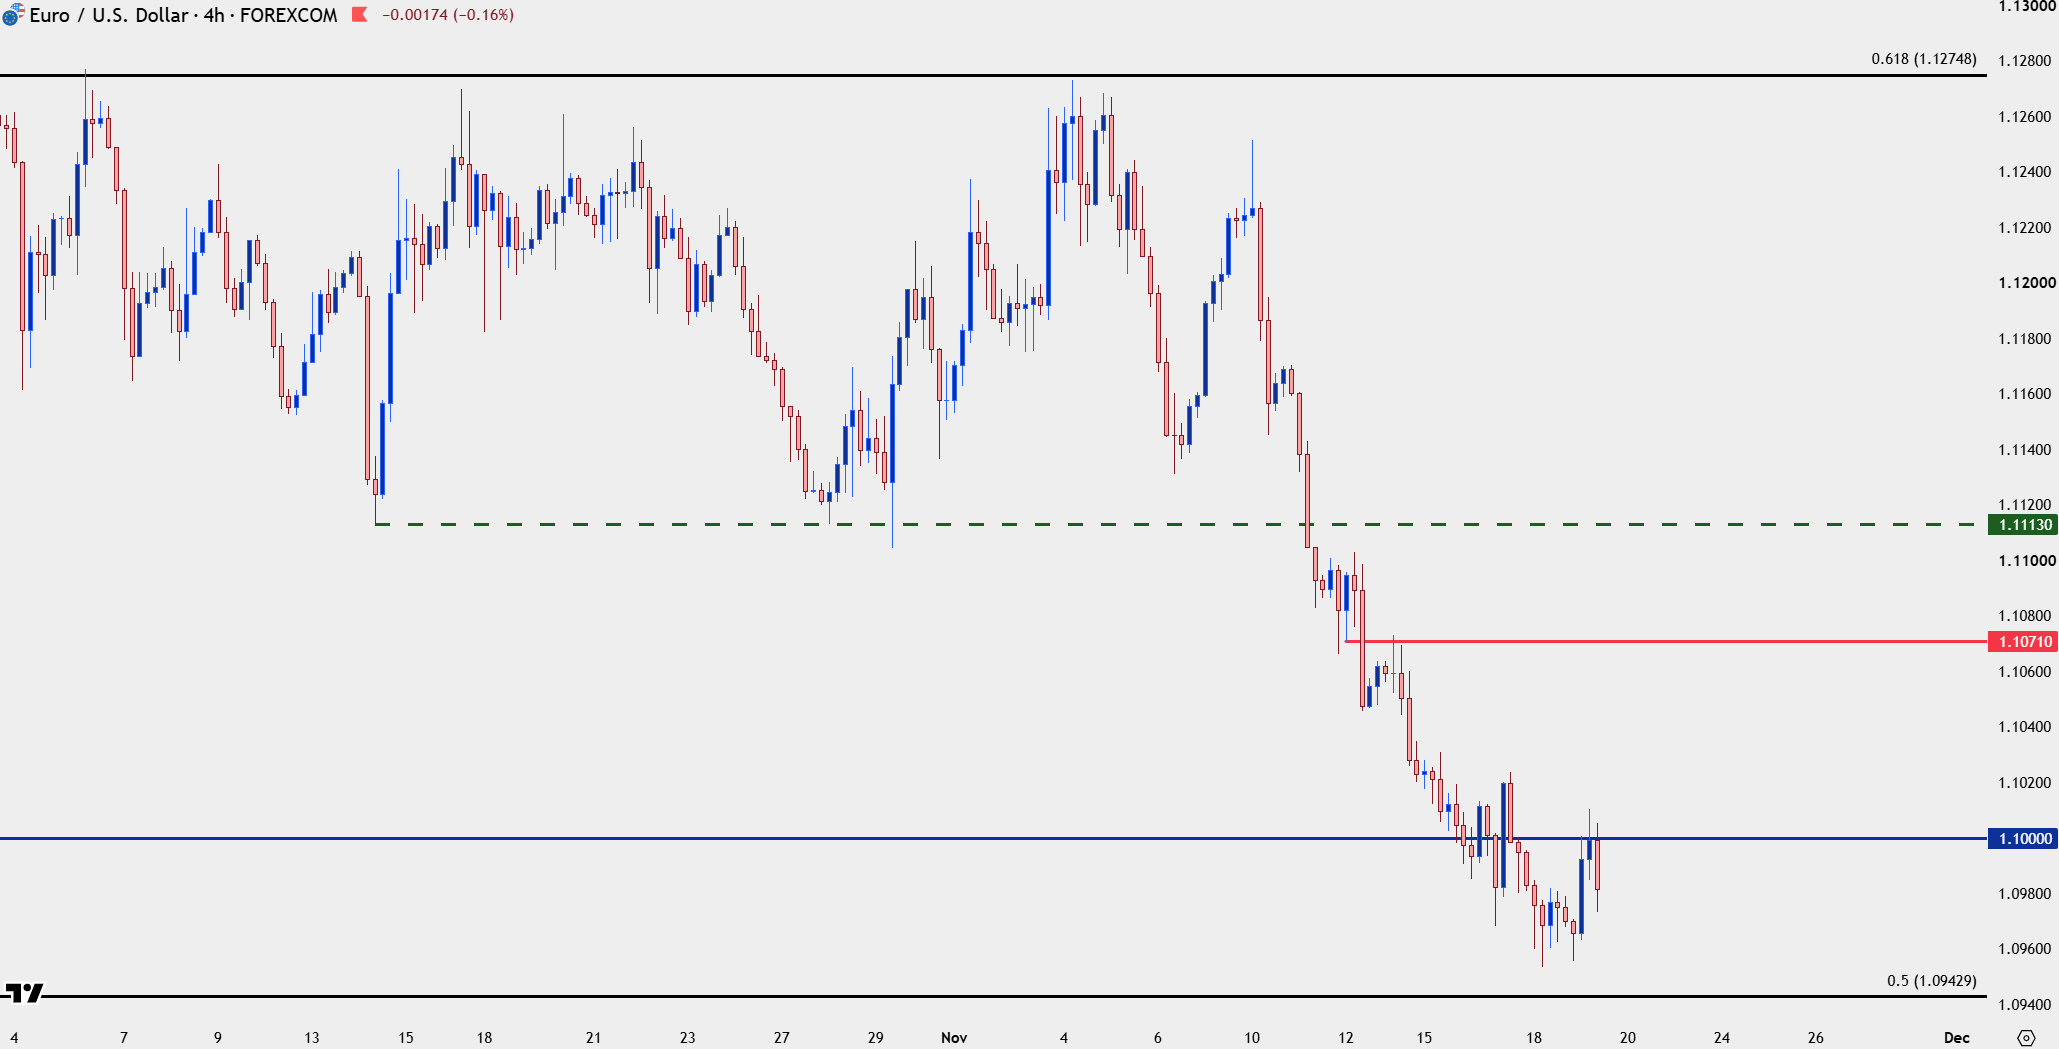
Chart prepared by James Stanley; data derived from Tradingview
--- written by James Stanley, Senior Market Analyst, Global Macro