Currency ranges have been typically miniscule ahead of today’s inflation report, with traders eager to see if consumer prices will track NFP employment figures higher. The relationship between employment and inflation is not exactly a tight one, as there are many factors (and not to mention various levels of lag) between the inflationary inputs. Or to put it simply, a strong employment report one month doesn’t necessarily equate to a firmer CPI report the next.

But we do know that US data is generally outperforming expectations more often than not at the moment, which run the risk of CPI data not softening as quickly as liked. Which is different to CPI coming in hot today, which I see as an unlikely scenario. In which case I have a hunch inflation data will be on or below target on net, which could be supportive of stocks and weaken the USD temporarily if correct.
EUR/USD technical analysis:
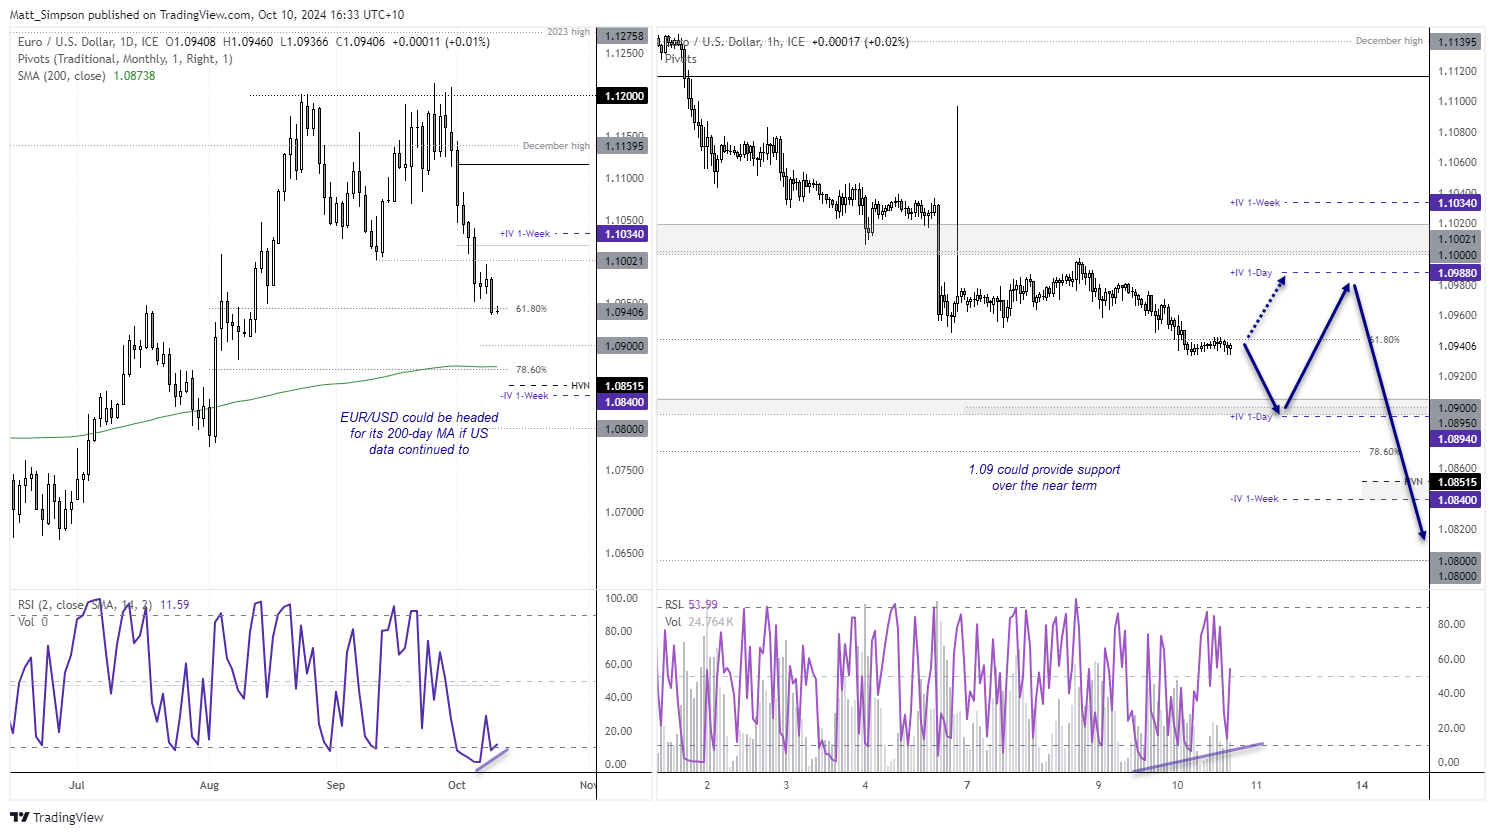
The rebound of the USD over the past eight trading days suggests there could be further downside to come for EUR/USD, especially if US data continues to outperform and the ECB provide a dovish cut next week. Momentum also suggests EUR/USD could be headed for the 1.09 handle and 200-day average. However, the daily RSI (2) has formed a bullish divergence within the oversold zone and we’re yet to see a more than a small pullback in this decline.
Should US inflation soften later today, it could spur some short covering on EUR/USD and a minor bounce. Prices are hugging the 61.8% Fibonacci level and hugging Wednesday’s low. The lower 1-day implied volatility level sits just beneath the monthly S2 pivot, which makes it a likely support level over the near-term. But given its round-number status it might provide a stronger bounce. However, bears are likely waiting to fade into any signs of strength, so at this stage I suspect any such bounce will be short lived and prices will eventually break below 1.09 on route to the 200-day MA.

Gold technical analysis:
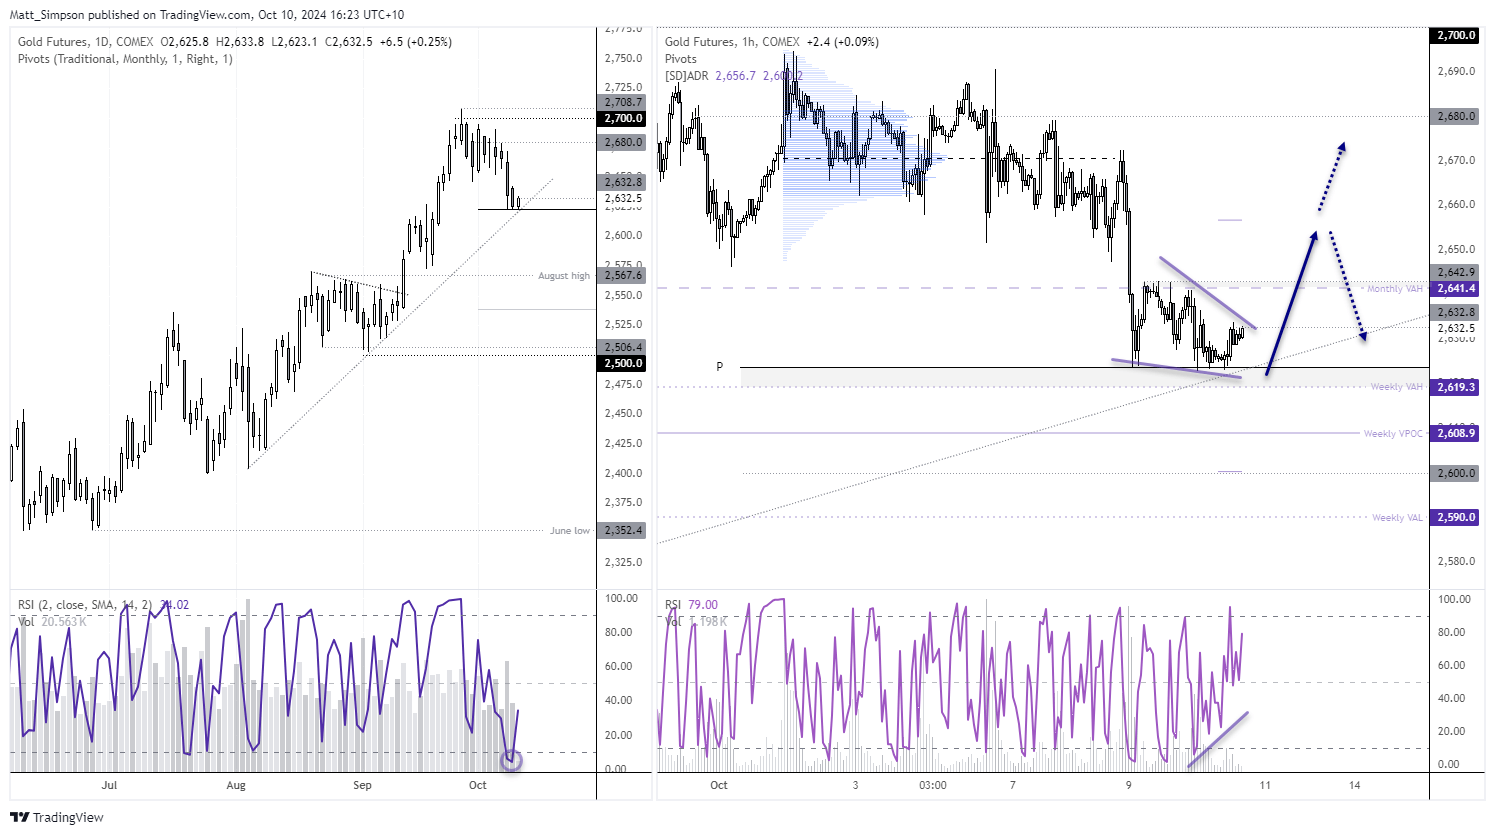
Gold futures remain in a well-established uptrend, even if they’re trading lower for a second week. However, prices are holding above the monthly pivot point and August 5 trendline, the daily RSI (2) has also curled higher from the oversold zone.
The 1-hour chart shows a loss of bearish momentum since gold prices fell beneath the monthly VAH (value area high), which has allowed a bullish divergence to form while prices held above the weekly VAH.
Based on price action alone, it looks like gold wants to move higher from current levels. Of course, that would likely require a softer-than-expected set of inflation figures today. But even if it comes in hot, the relative downside could be limited to upside potential given gold has already retraced lower for the past four days.

-- Written by Matt Simpson
Follow Matt on Twitter @cLeverEdge


