Weekly Technical Trade Levels on USD Majors, Commodities & Stocks
- Technical setups we are tracking into the weekly open, US CPI on tap
- Next Weekly Strategy Webinar: Tuesday, February 20 at 8:30am EST
- Review the latest Weekly Strategy Webinars on my YouTube playlist.
In this webinar we take an in-depth look at the technical trade levels for the US Dollar (DXY), Euro (EUR/USD), British Pound (GBP/USD), Canadian Dollar (USD/CAD), Australian Dollar (AUD/USD), Japanese Yen (USD/JPY), Swiss Franc (USD/CHF), Gold (XAU/USD), Crude Oil (WTI), S&P 500 (SPX500), Nasdaq (NDX), and the Dow Jones (DJI). These are the levels that matter on the technical charts heading into the weekly open.
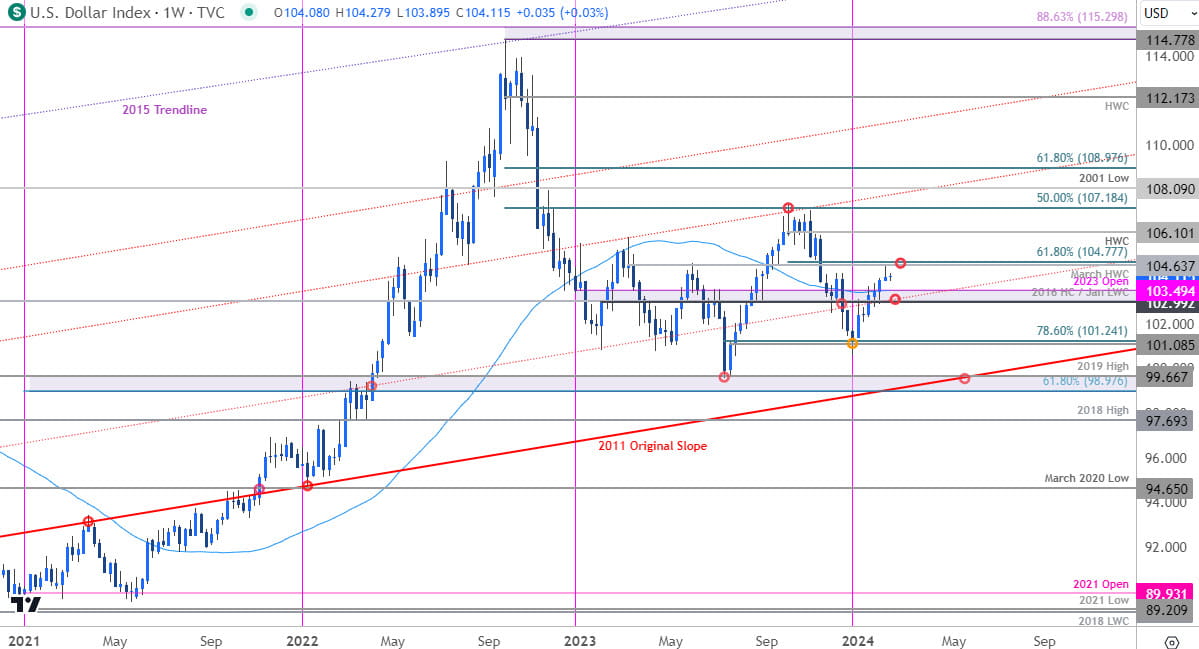
US Dollar Price Chart – USD Weekly (DXY)

Chart Prepared by Michael Boutros, Sr. Technical Strategist; DXY on TradingView
Our last USD updated note that, “the immediate focus is on a reaction into 104.63/77 IF reached- a region is defined by the March high-week close (HWC) & the 61.8% retracement of the October decline and converges on near-term uptrend resistance.” The index registered an intraweek high at 104.60 before closing the fourth consecutive weekly advance.
While the broader outlook remains constructive, the January advance may be vulnerable while below this threshold. Weekly support steady at 103.49 with medium-term bullish invalidation at the 103-handle. A topside breach from here would expose the 2023 high-week close (HWC) at 106.10.
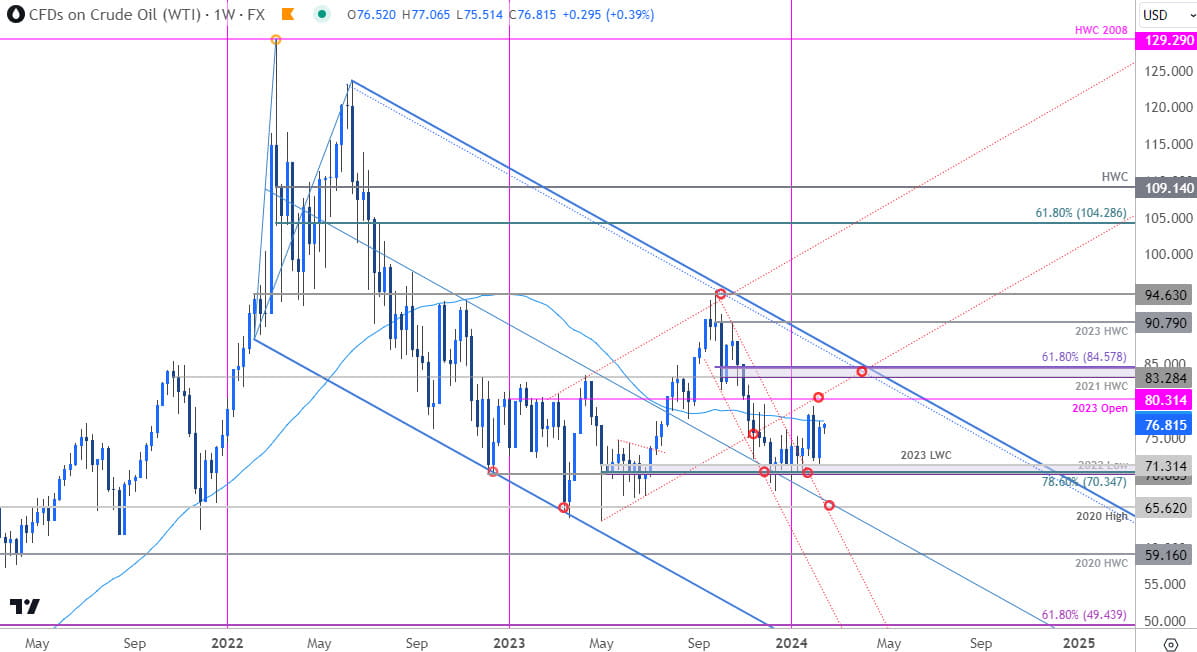
Oil Price Chart – Crude Weekly (WTI)

Chart Prepared by Michael Boutros, Technical Strategist; WTI on TradingView
In last week's webinar, we noted that oil prices were, “once again approaching a critical support zone we’ve been tracking for years now at 70.06-71.31- a region defined by 2022 swing low, the 78.6% retracement of the 2023 range, and the objective 2023 low-week close. Looking for a reaction into this critical pivot-zone IF reached for guidance this week.”
WTI registered an intraweek low at 71.38 before rebounding sharply with price rallying nearly 8% off last week’s low. The advance is now testing resistance at the 52-week moving average (currently ~77.28) with the 2023 yearly--open just higher at 80.31. Key resistance / broader bearish invalidation steady at the 2021 high-week close / 61.8% retracement at 84.28/57. Look for a breakout of the February opening-range here for guidance.
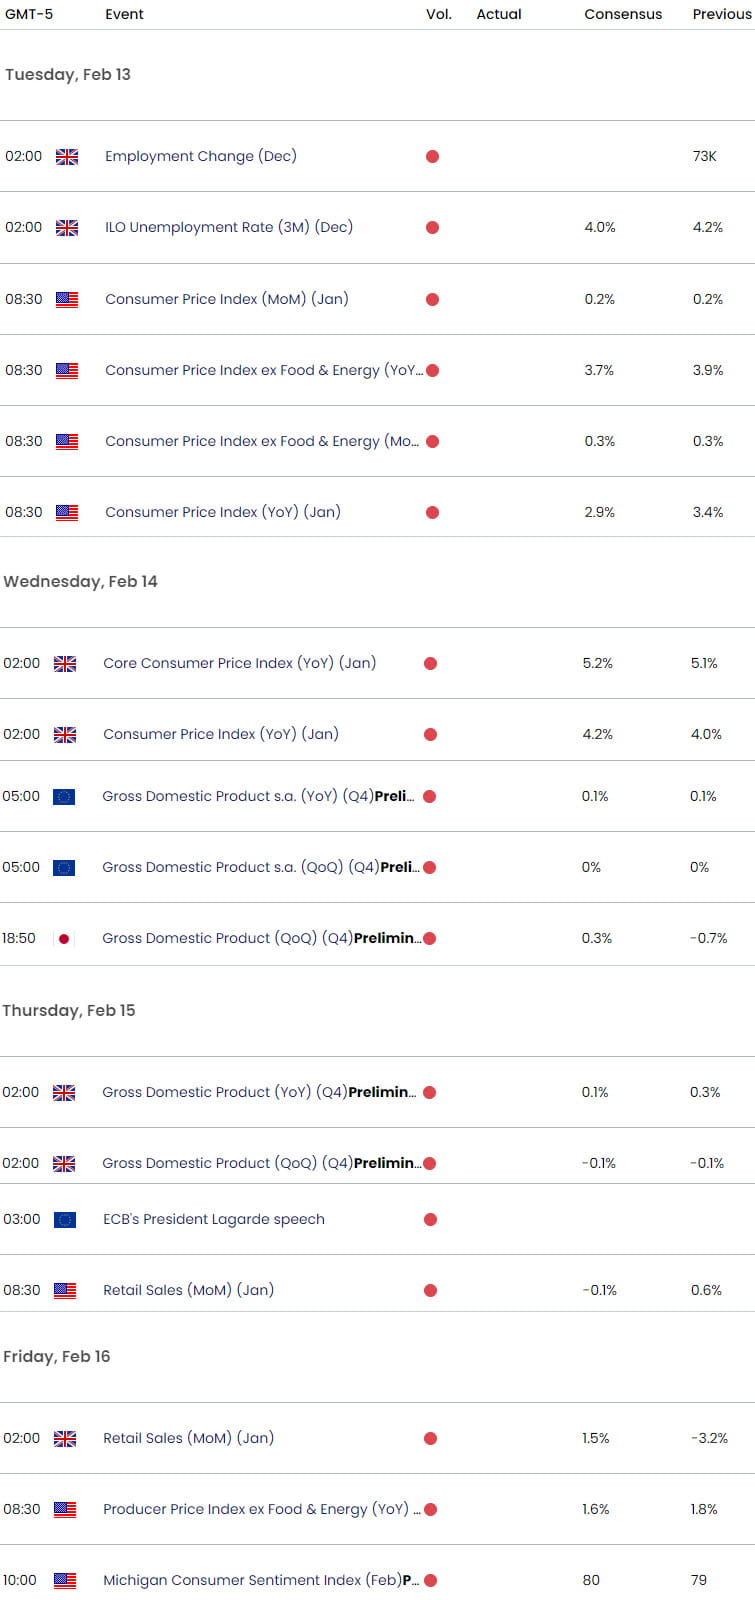
Economic Calendar – Key USD Data Releases

Economic Calendar - latest economic developments and upcoming event risk.
--- Written by Michael Boutros, Sr Technical Strategist with FOREX.com
Follow Michael on X @MBForex


