Weekly Technical Trade Levels on USD Majors, Commodities & Stocks
- Technical setups we’re tracking into the October / Q4 open
- Next Weekly Strategy Webinar: Monday, October 9 at 8:30am EST
- Review the latest Weekly Strategy Webinars on my YouTube playlist.
In this webinar we take an in-depth look at the technical trade levels for the US Dollar (DXY), Euro (EUR/USD), British Pound (GBP/USD), Canadian Dollar (USD/CAD), Australian Dollar (AUD/USD), Japanese Yen (USD/JPY), Gold (XAU/USD), Silver (XAG/USD), NZD/JPY, Crude Oil (WTI), S&P 500 (SPX500), Nasdaq (NDX) and Dow Jones (DJI). These are the levels that matter on the technical charts heading into the October / Q4 open.
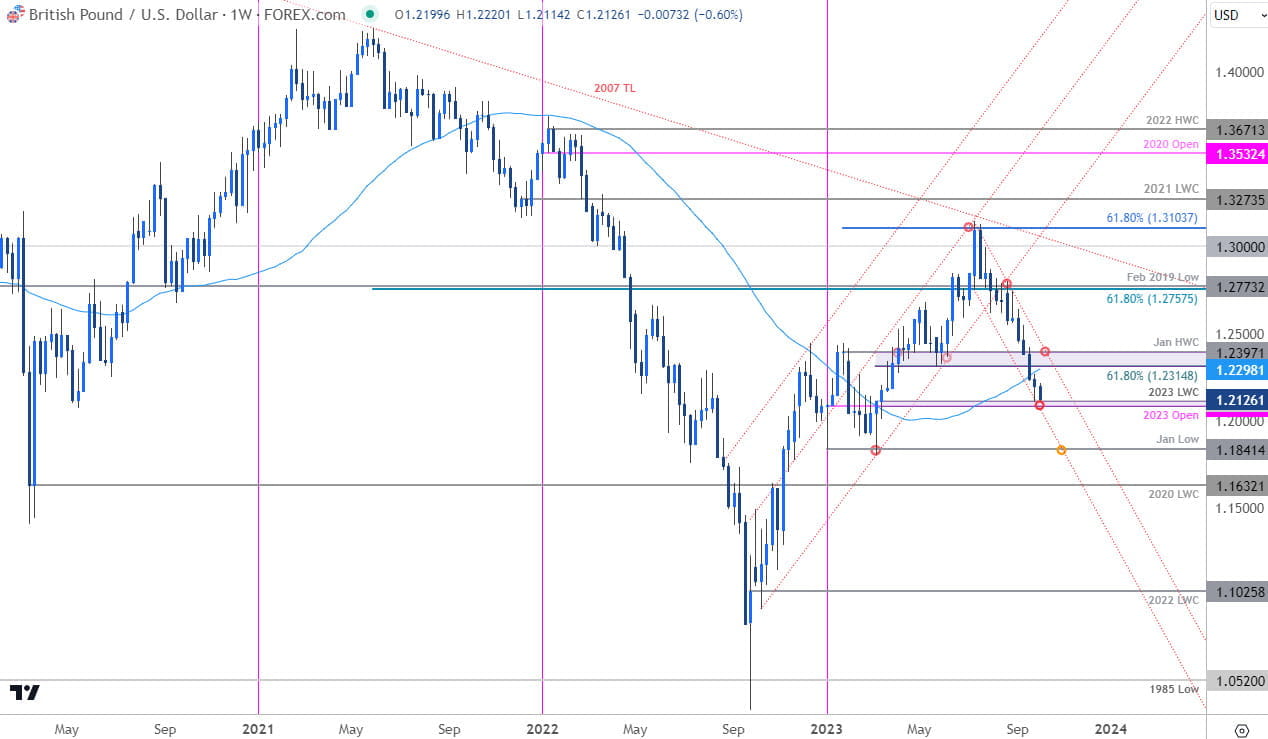
British Pound Price Chart – GBP/USD Weekly

Chart Prepared by Michael Boutros, Sr. Technical Strategist; GBP/USD on TradingView
Sterling is testing confluent support this week into the objective yearly-open / 2023 low week close at 1.2084-1.2113- risk for some downside exhaustion here. Losses below this threshold could fuel another accelerated bout of losses towards the January lows at 1.1841. Weekly resistance eyed at 1.2298-1.2314 with medium-term bearish invalidation now lowered to 1.2397.
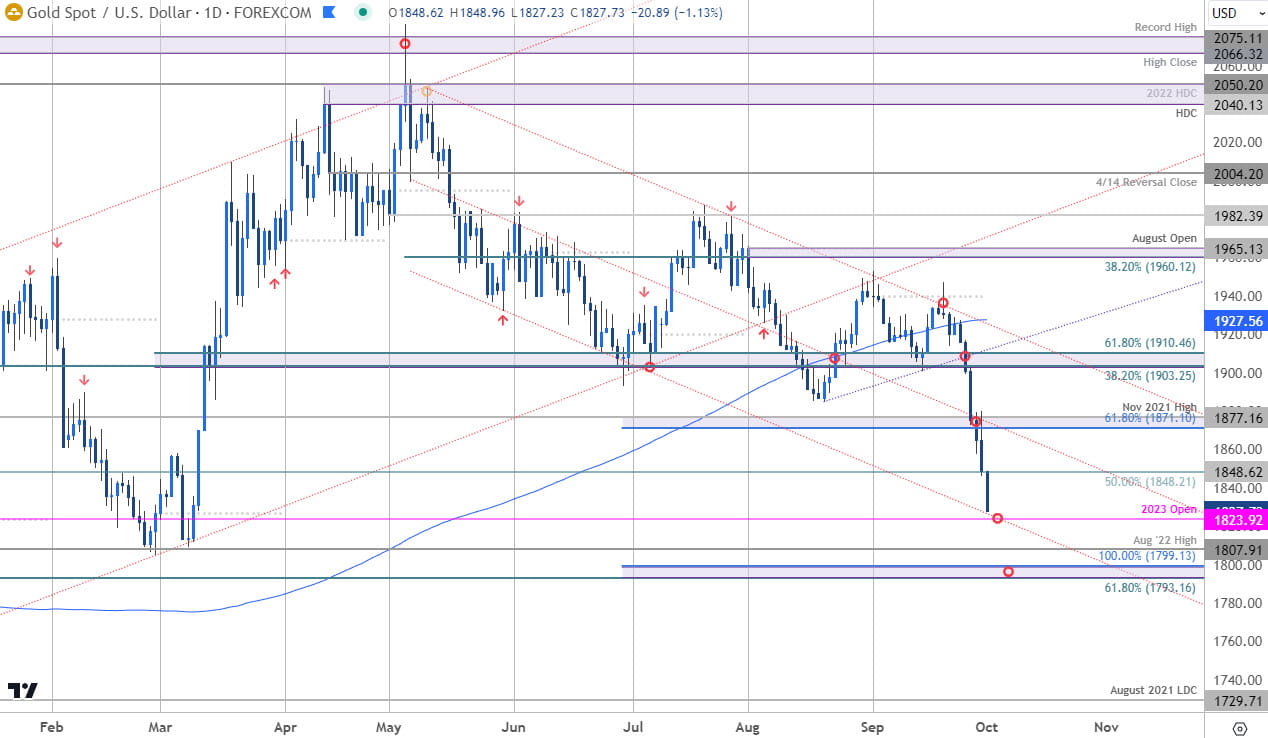
Gold Price Chart – XAU/USD Daily

Chart Prepared by Michael Boutros, Sr. Technical Strategist; XAU/USD on TradingView
A break below key support last week in gold has unleashed a massive six-day sell-off with the decline now approaching confluent support around the objective yearly open at 1823. Momentum is deep in oversold territory here and the momentum is on the side of the bears for now.
Subsequent support objectives are eyed at the August 2022 pivot zone at 1807 and 1793/99- a region defined by the 61.8% retracement of the 2022 advance and the 100% extension of the yearly decline. Looking for possible downside exhaustion into this key zone IF reached. Initial resistance now back at 1848 with near-term bearish invalidation now lowered to 1871/77.
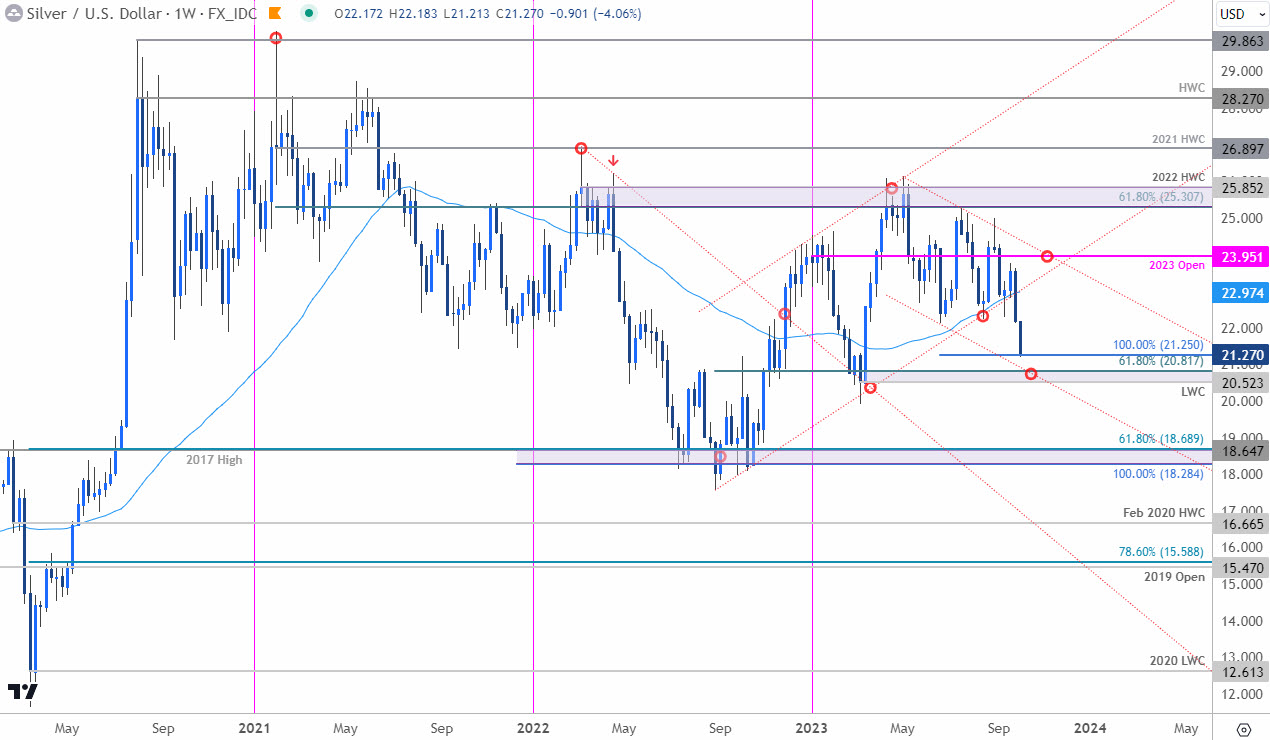
Silver Price Chart – XAG/USD Daily

Chart Prepared by Michael Boutros, Sr. Technical Strategist; XAG/USD on TradingView
The silver trade looks similar to gold (although a bit delayed) with the decline now testing initial support into the 100% extension of the yearly decline at 21.25. A more significant support confluence rests just lower into the yearly low-week close / 61.8% Fibonacci retracement of the 2022rally at 20.52/81- an are of interest for possible downside exhaustion IF reached. Resistance now eyed back at the 52-week moving average, currently near the 23-handle.
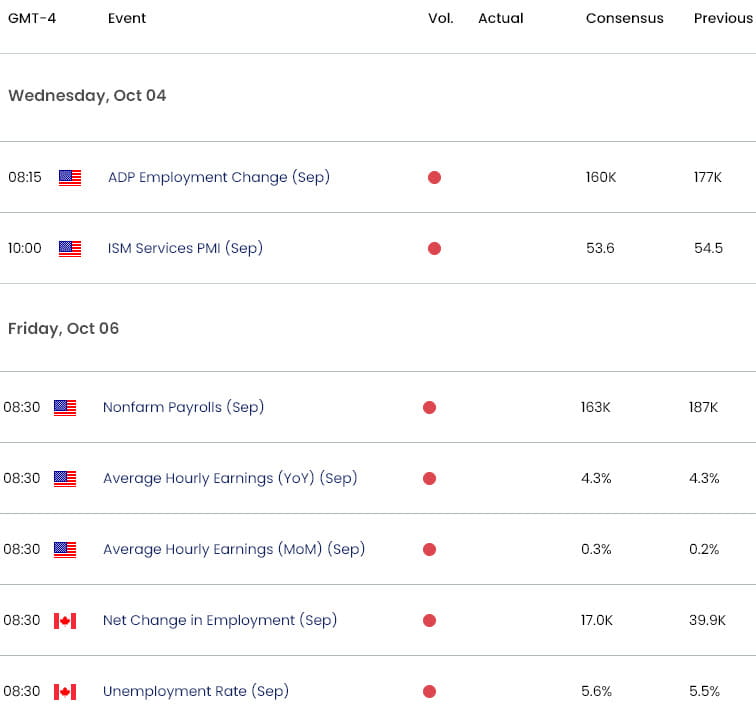
Economic Calendar – Key Data Releases

Economic Calendar - latest economic developments and upcoming event risk.
--- Written by Michael Boutros, Sr Technical Strategist with FOREX.com
Follow Michael on Twitter @MBForex


