Weekly Technical Trade Levels on USD Majors, Commodities & Stocks
- Technical setups we’re tracking into the weekly/ yearly open
- Next Weekly Strategy Webinar: Monday, January 22 at 8:30am EST
- Review the latest Weekly Strategy Webinars on my YouTube playlist.
In this webinar we take an in-depth look at the technical trade levels for the US Dollar (DXY), Euro (EUR/USD), British Pound (GBP/USD), Australian Dollar (AUD/USD), Japanese Yen (USD/JPY), Canadian Dollar (USD/CAD), Swiss Franc (USD/CHF), Gold (XAU/USD), Crude Oil (WTI) and the S&P 500 (SPX500). These are the levels that matter on the technical charts heading into the weekly open.
Euro Price Chart – EUR/USD Daily

Chart Prepared by Michael Boutros, Sr. Technical Strategist; EUR/USD on TradingView
A rally of more than 3.8% off the December lows faltered into the 1.11-handle into the close o the year with EUR/USD plunging nearly 2.4% off the highs. The levels are clear into the January open with the focus on this correction off uptrend resistance. Initial support 1.0875 with near-term bullish invalidation now raised to the July low / 200-day moving average at 1.0835/45. Monthly open resistance converges on the 61.8% Fibonacci retracement at 1.1038/39 with a close above 1.11 needed to mark uptrend resumption.
British Pound Price Chart – GBP/USD Daily

Chart Prepared by Michael Boutros, Sr. Technical Strategist; GBP/USD on TradingView
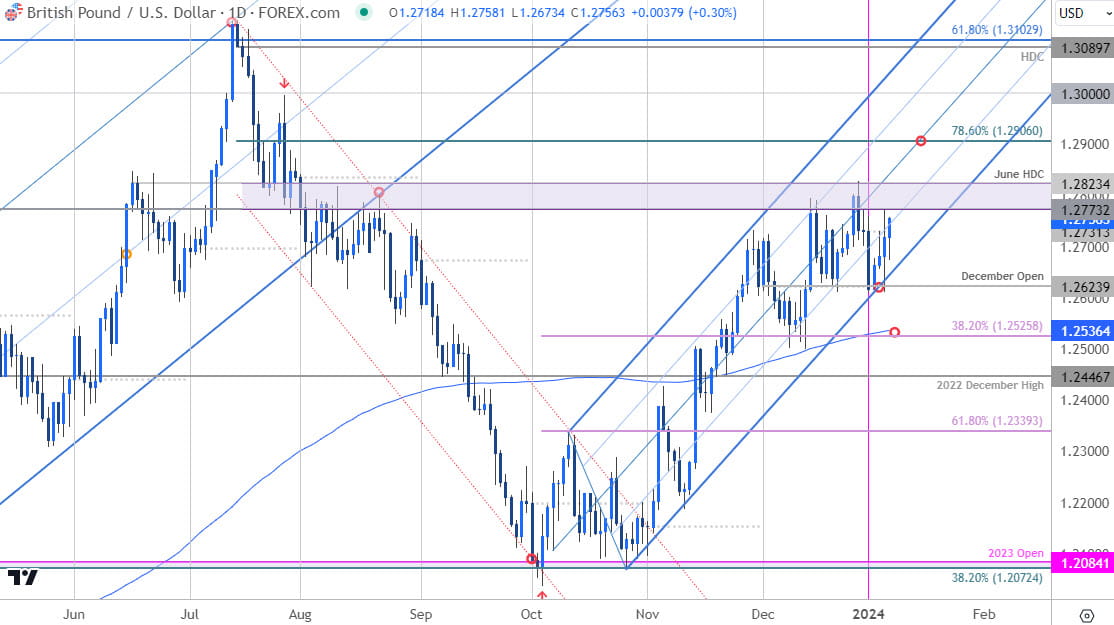
The British Pound is carving a well-defined monthly opening-range just below confluent resistance at 1.2773-1.2823- looking for the breakout to offer guidance here. We’ve been tracking this same pitchfork for months now- look for support along the lower parallel with a bullish invalidation steady at the December opening around 1.2624. I’ll publish an updated British Pound Short-term Outlook later this week with a closer look the near-term GBP/USD technical trade levels.
S&P 500 Price Chart – SPX500 Daily

Chart Prepared by Michael Boutros, Technical Strategist; SPX500 on TradingView
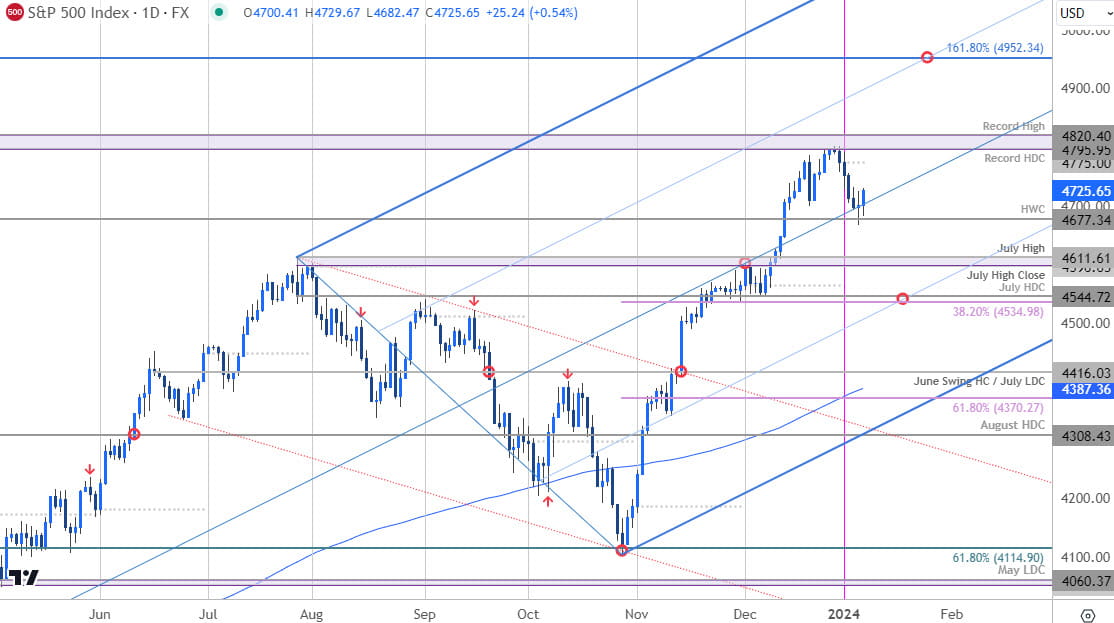
The S&P 500 opened the year just below technical resistance at 4795-4820- a region defined by the 2022 record high-day close and the record high. A five-day retreat responded to slope support last week near the 2022 high-week close at 4677. The monthly opening-range is set just below resistance- breakout pending with the bulls vulnerable while below the monthly / yearly-open at 4775.
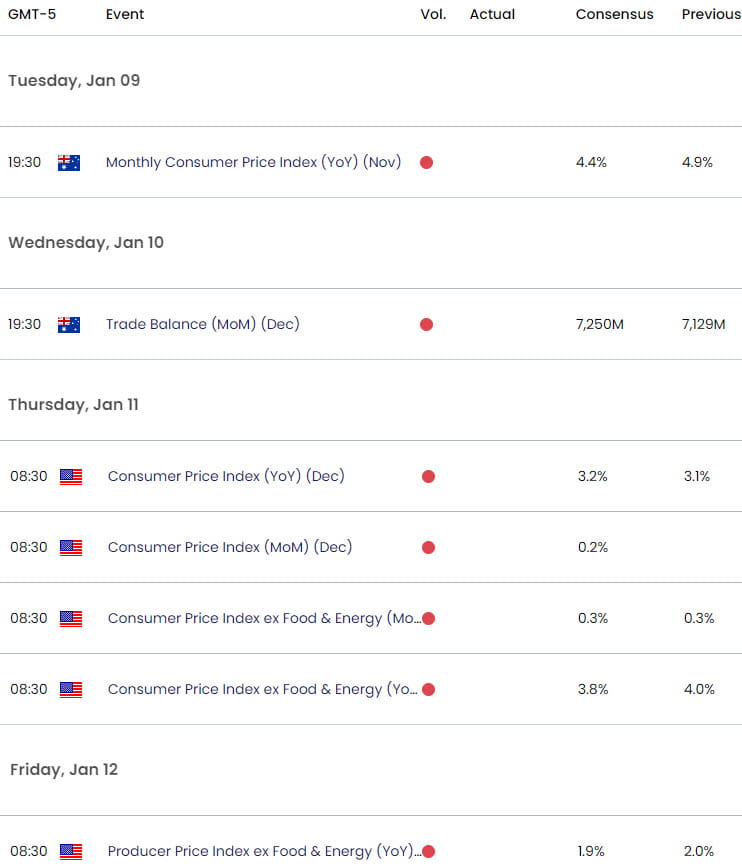
Economic Calendar – Key USD Data Releases

Economic Calendar - latest economic developments and upcoming event risk.
--- Written by Michael Boutros, Sr Technical Strategist with FOREX.com
Follow Michael on X @MBForex


