Weekly Technical Trade Levels on USD Majors, Commodities & Stocks
- Technical setups we are tracking into the weekly open– RBA, BoE rate decisions on tap
- Next Weekly Strategy Webinar: Monday, June 24 at 8:30am EST
- Review the latest Weekly Strategy Webinars or Stream Live on my YouTube playlist.
In this webinar we take an in-depth look at the technical trade levels for the US Dollar (DXY), 10yr Treasury Yields, Euro (EUR/USD), British Pound (GBP/USD), Japanese Yen (USD/JPY), Australian Dollar (AUD/USD), Canadian Dollar (USD/CAD), Swiss Franc (USD/CHF), Gold (XAU/USD), Crude Oil (WTI), S&P 500 (SPX500), Nasdaq (NDX), Dow Jones (DJI), Bitcoin (BTC/USD) and the Mexican Peso (USD/MXN). These are the levels that matter on the technical charts heading into the weekly open.
Euro Price Chart – EUR/USD Weekly

Chart Prepared by Michael Boutros, Sr. Technical Strategist; EUR/USD on TradingView
Euro is trading just above a major support zone we’ve been tracking for weeks now at the yearly low-week close (LWC) / low-close around 1.0641/67 and the 78.6% retracement / 2023 LWC at 1.0587/96 – both area of interest for possible downside exhaustion / price inflection IF reached. Initial weekly resistance now stands at June high-week reversal close / 52-week moving average at 1.0801/18. Key resistance remains unchanged at 1.0933/42.
Bottom line: From a trading standpoint, a good zone to reduce portions of short-exposure / lower protective stops – rallies should be limited to the 52-week moving average IF Euro is heading lower on this stretch. Review my latest Euro Short-term Outlook for a closer look at the near-term EUR/USD technical trade levels.
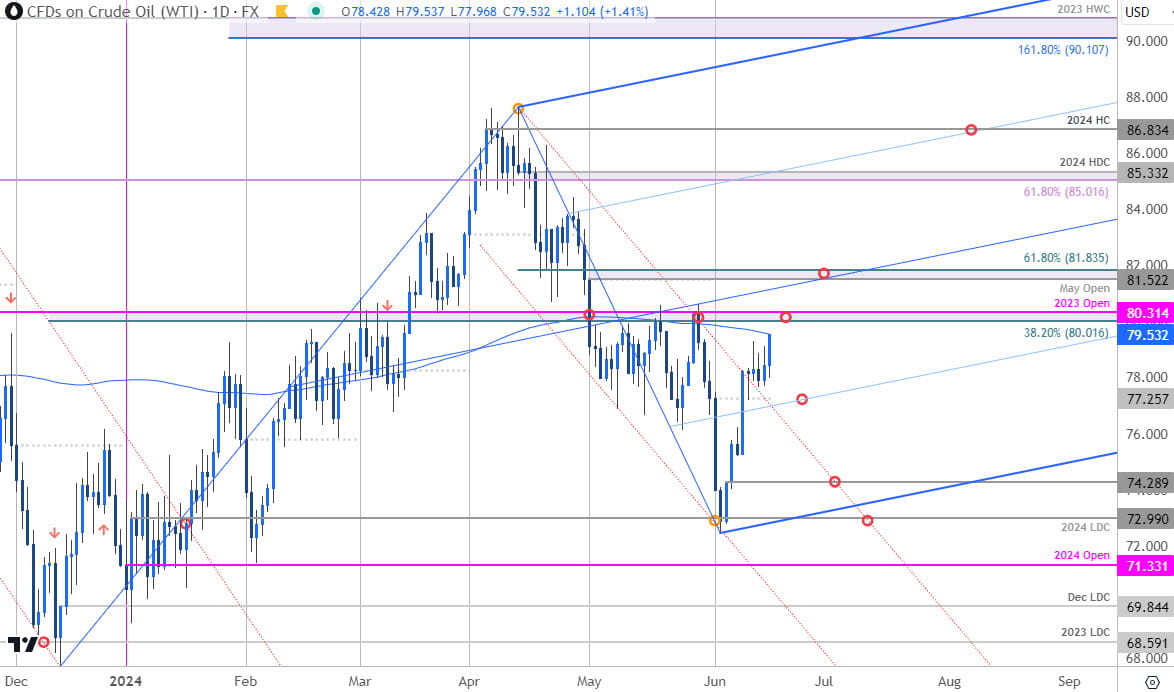
Oil Price Chart – WTI Weekly

Chart Prepared by Michael Boutros, Technical Strategist; WTI on TradingView
A V-shaped recovery in oil prices off confluent support at the 2024 low-day close (LDC at 72.99) has already rallied nearly 10% off the lows. The focus is on near-term resistance here at the 200-day moving average (79.55) and the 38.2% retracement / 2023 yearly open at 80.01/31. Ultimately, a topside breach / close above 81.83 is needed to suggest a more significant low was registered this month / mark uptrend resumption. Monthly open support rests at 77.25 and is backed by the June 5th reversal close at 74.29- losses should be limited to this threshold IF price is heading higher on this stretch.
Economic Calendar – Key USD Data Releases

Economic Calendar - latest economic developments and upcoming event risk.
--- Written by Michael Boutros, Sr Technical Strategist with FOREX.com
Follow Michael on X @MBForex


