Weekly Technical Trade Levels on USD Majors, Commodities & Stocks
- Technical setups we are tracking into the weekly open
- Next Weekly Strategy Webinar: Monday, March 18 at 8:30am EST
- Review the latest Weekly Strategy Webinars on my YouTube playlist.
In this webinar we take an in-depth look at the technical trade levels for the US Dollar (DXY), US Treasury Yields, Euro (EUR/USD), British Pound (GBP/USD), Australian Dollar (AUD/USD), Canadian Dollar (USD/CAD), Japanese Yen (USD/JPY), Swiss Franc (USD/CHF), Gold (XAU/USD), Crude Oil (WTI), S&P 500 (SPX500), Nasdaq (NDX), Dow Jones (DJI) and Bitcoin (BTC/USD). These are the levels that matter on the technical charts heading into the weekly open.
US Dollar Price Chart – USD Daily (DXY)

Chart Prepared by Michael Boutros, Sr. Technical Strategist; DXY on TradingView
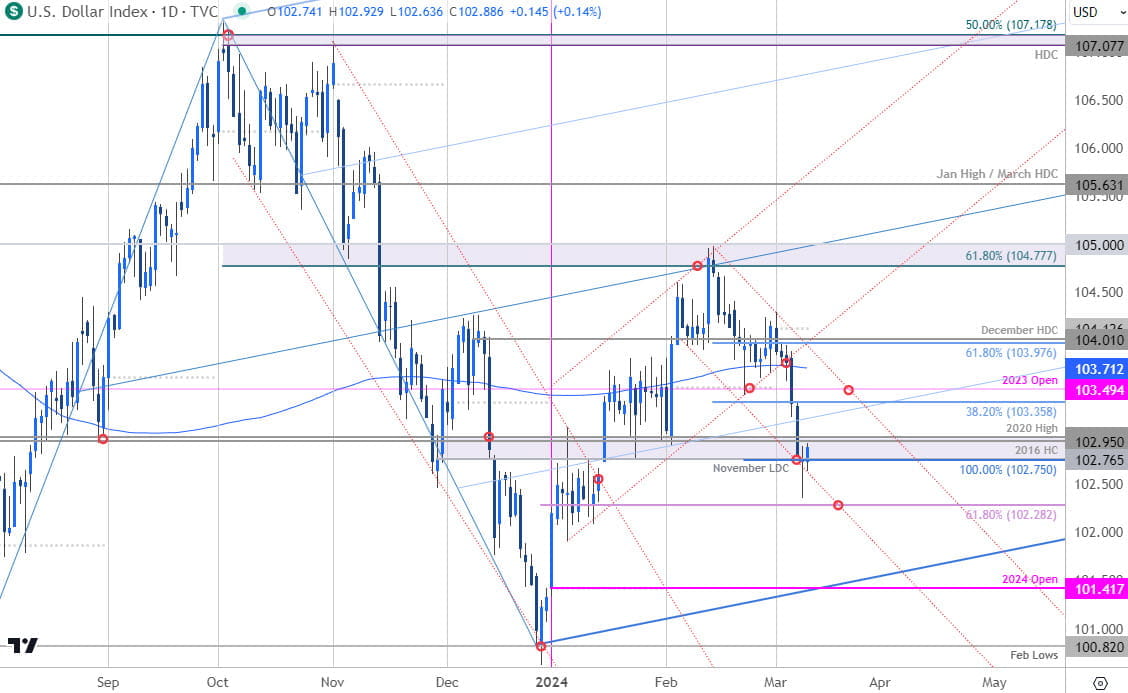
The US Dollar broke below the January uptrend last week with the decline exhausting into confluent support on Friday at 102.75/95- a region defined by the 100% extension of the February decline, November low-day close (LDC), the 2016 high-close (HC), and the 2020 swing high. Looking for a reaction off this mark. Initial resistance at 103.35 backed by the 2023 yearly open at 103.49- rallies should be limited by this threshold IF price is heading lower with a break exposing the 61.8% retracement at 102.28.
Euro Price Chart – EUR/USD Daily

Chart Prepared by Michael Boutros, Sr. Technical Strategist; EUR/USD on TradingView
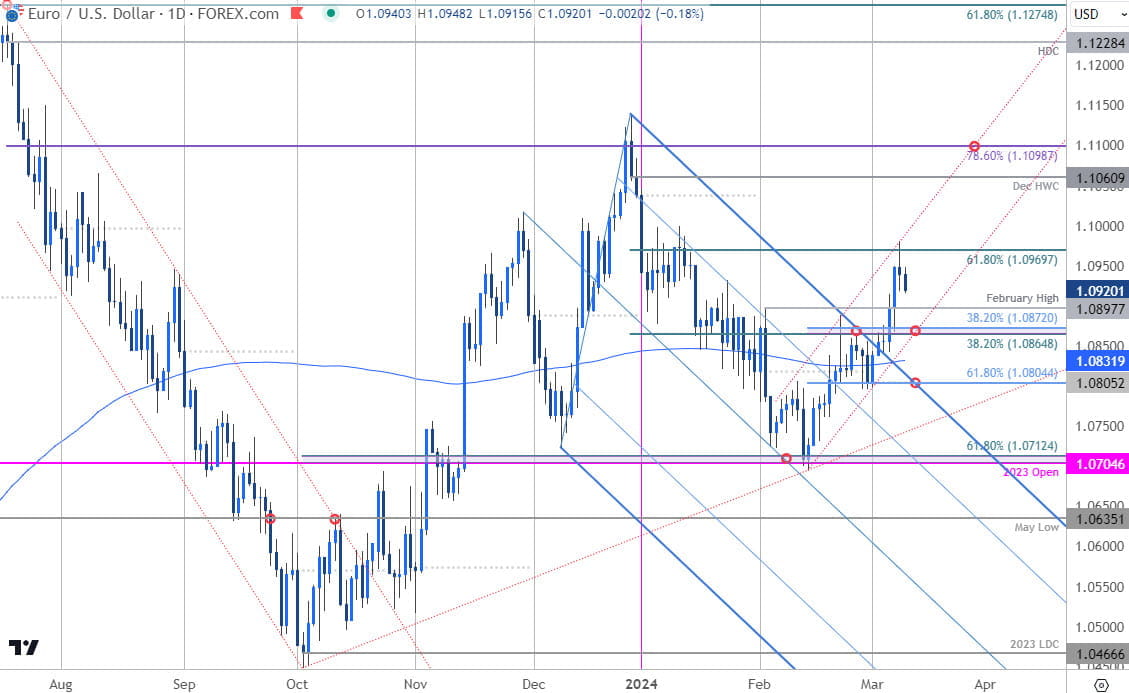
The Euro breakout exhausted into confluent resistance on Friday at the upper parallel / 61.8% Fibonacci retracement of the December decline around 1.0970 (intraday high registered at 1.0981). The immediate advance may be vulnerable here, but the broader outlook remains constructive while within this channel. Initial support 1.0897 backed by 1.0864/72. Broader bullish invalidation now raised to the monthly open / 61.8% retracement at 1.0804/05.
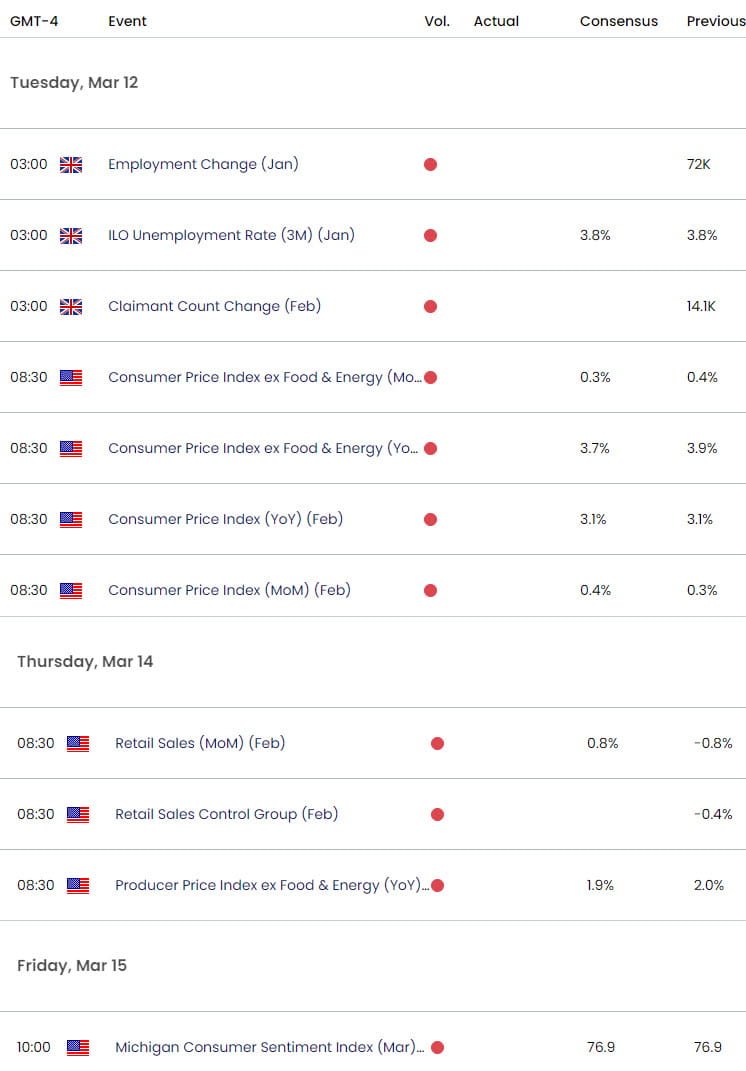
A topside breach/ close above 1.0970 could fuel another accelerated advance with subsequent resistance objectives eyed at the December high-week close (HWC) at 1.1060 and the 78.6% retracement at 1.1099. Key US inflation data on tap tomorrow- watch the weekly close here.
Economic Calendar – Key USD Data Releases

Economic Calendar - latest economic developments and upcoming event risk.
--- Written by Michael Boutros, Sr Technical Strategist with FOREX.com
Follow Michael on X @MBForex


