Weekly Technical Trade Levels on USD Majors, Commodities & Stocks
- Technical setups we are tracking into the weekly open- ECB, US retail sales on tap
- Next Weekly Strategy Webinar: Monday, October 21 at 8:30am EST
- Review the latest Video Updates or Stream Live on my YouTube playlist.
In this webinar we take an in-depth look at the technical trade levels for the US Dollar (DXY), Euro (EUR/USD), British Pound (GBP/USD), Australian Dollar (AUD/USD), Canadian Dollar (USD/CAD), Japanese Yen (USD/JPY), GBP/JPY, Swiss Franc (USD/CHF), Gold (XAU/USD), Crude Oil (WTI), S&P 500 (SPX500), Nasdaq (NDX) and the Dow Jones (DJI). These are the levels that matter on the technical charts heading into the weekly open.
Canadian Dollar Price Chart – USD/CAD Daily

Chart Prepared by Michael Boutros, Sr. Technical Strategist; USD/CAD on TradingView
The US Dollar is poised to mark a ninth consecutive-daily advance against the Loonie with USD/CAD testing confluent resistance today at 1.3788/92- a region defined by the 1.618% extension of the September range and the objective June high. Looking for a reaction here this week with a breach / close above needed to keep the long-bias viable towards 1.3825 and the upper parallel near ~1.3850. Key resistance steady at 1.3881/99. Support rest with the 1.37-handle with bullish invalidation now raised to 1.3613/21. Canada CPI on tap tomorrow.
Gold Price Chart – XAU/USD Weekly

Chart Prepared by Michael Boutros, Sr. Technical Strategist; XAU/USD on TradingView
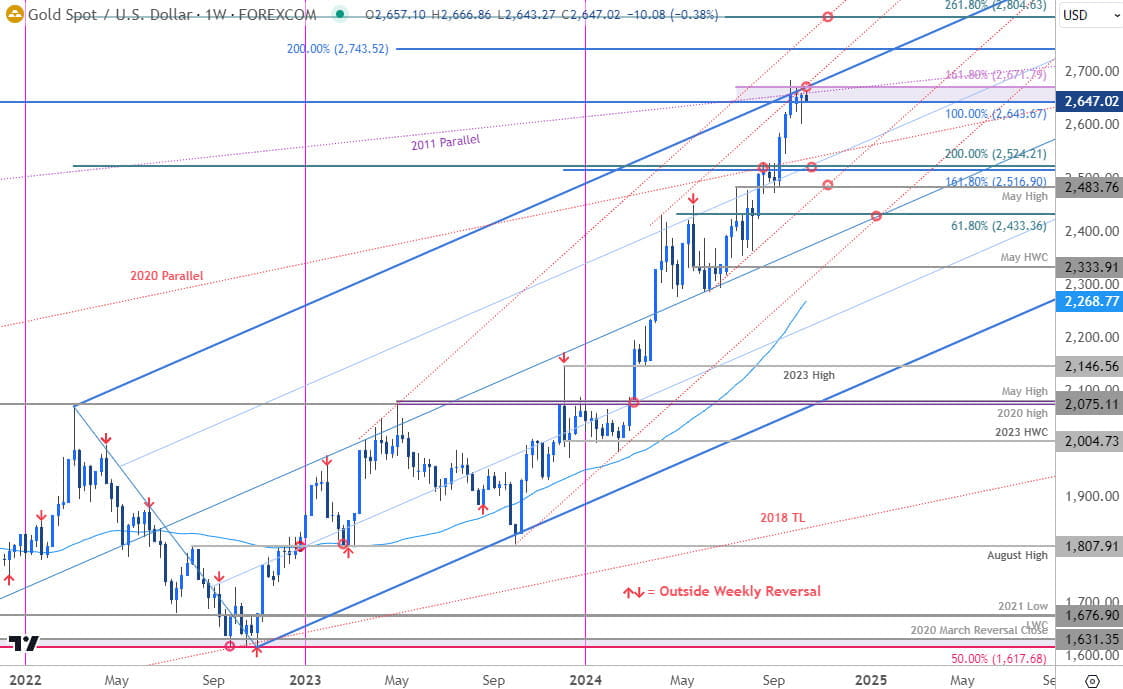
Gold is trading into a major resistance zone for a fourth week at 2643/71- a region defined by the 100% extension of the 2015 advance and the 1.618% extension of the June advance. Note that numerous upslopes converge on this threshold and further highlight the technical significance of this region.
The focus remains on possible inflection here with the immediate advance vulnerable while below. Weekly support rests at 2516/24 backed by the May high at 2483. Broader bullish invalidation now raised to the 61.8% retracement of the April rally at 2433. A topside breach above this pivot zone exposes subsequent resistance objectives at 2743 ad the 2.618% extension of the 2022 range at 2804- look for a larger reaction there IF reached.
Oil Price Chart – WTI 240min

Chart Prepared by Michael Boutros, Technical Strategist; WTI on TradingView
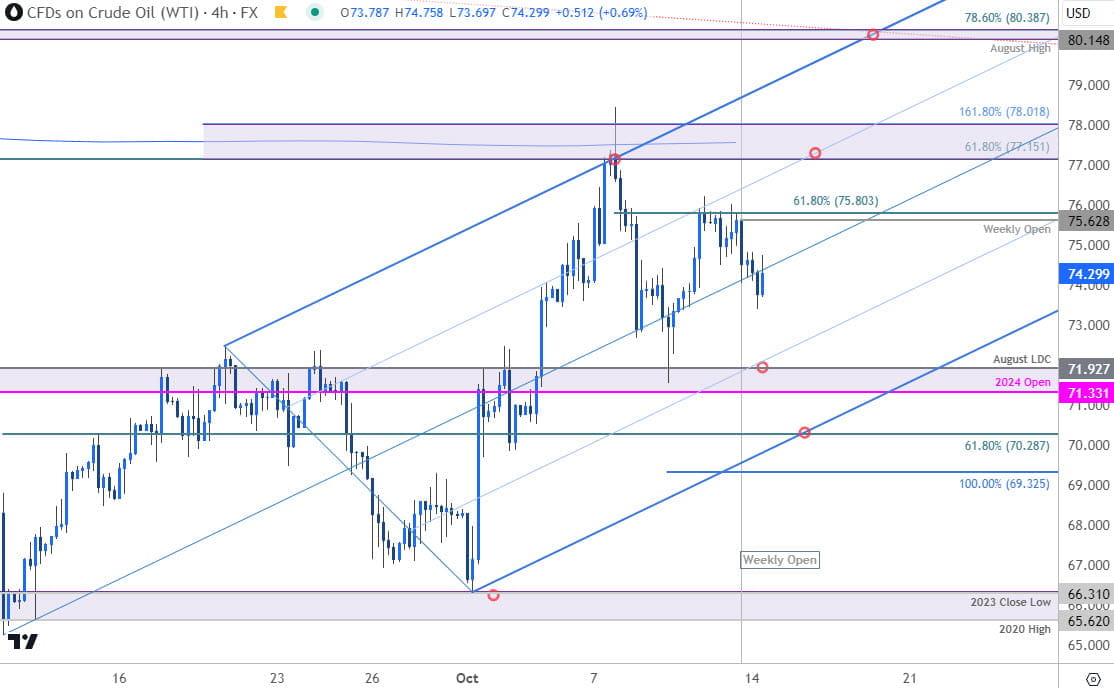
Oil is trading mid-range to start the week and while the medium-term outlook is still constructive, the risk remains for a deeper correction within the September uptrend. Support objectives eyed at 71.33/93 and 70.29- both levels of interest for possible downside exhaustion IF reached. Broader bullish invalidation now set to the 100% extension at 69.32.
Initial resistance stands at 75.63/80 backed by a major technical confluence at 77.15-78.01- a breach / close above this threshold is needed to mark uptrend resumption towards the next major pivot zone at 80.14/39- look for a larger reaction there IF reached.
Economic Calendar – Key USD Data Releases

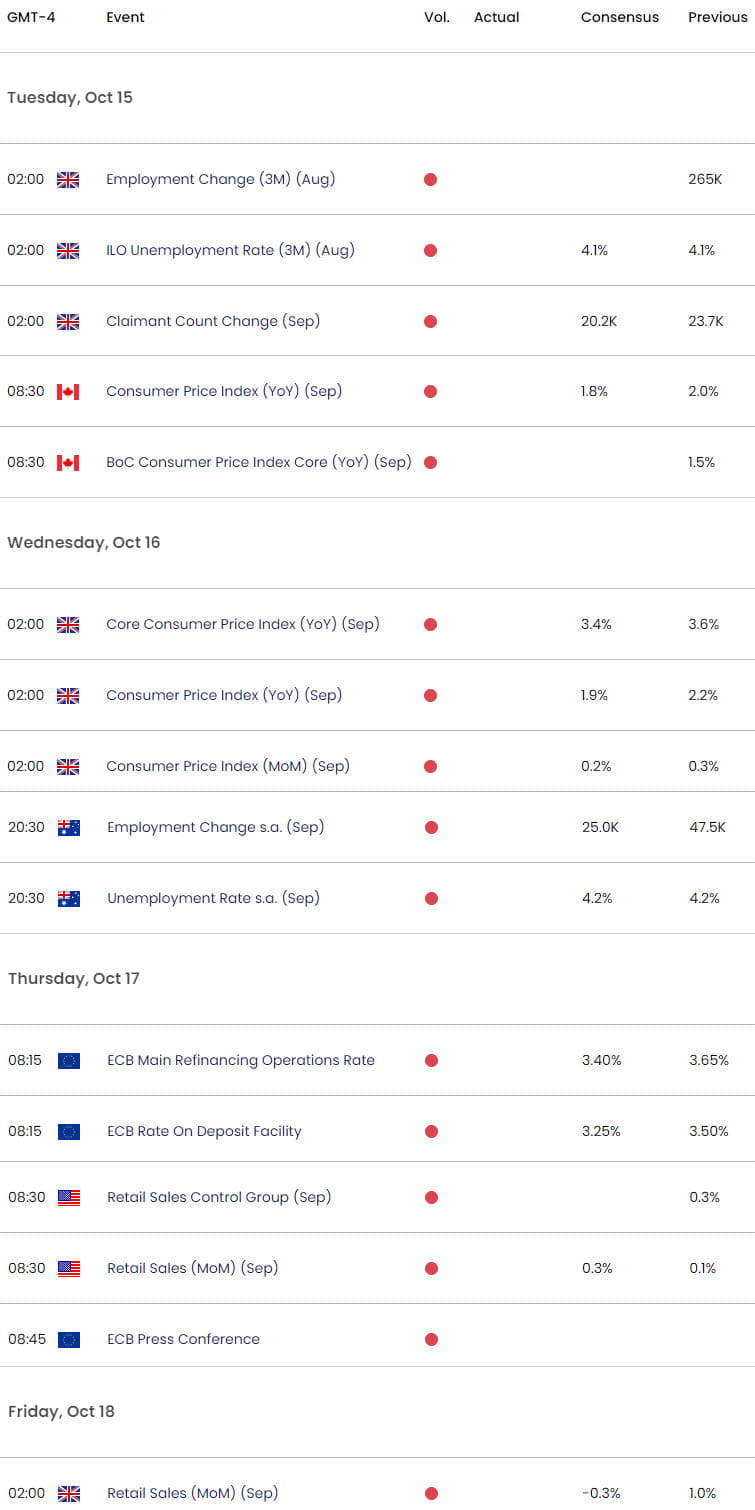
Economic Calendar - latest economic developments and upcoming event risk.
--- Written by Michael Boutros, Sr Technical Strategist
Follow Michael on X @MBForex


