
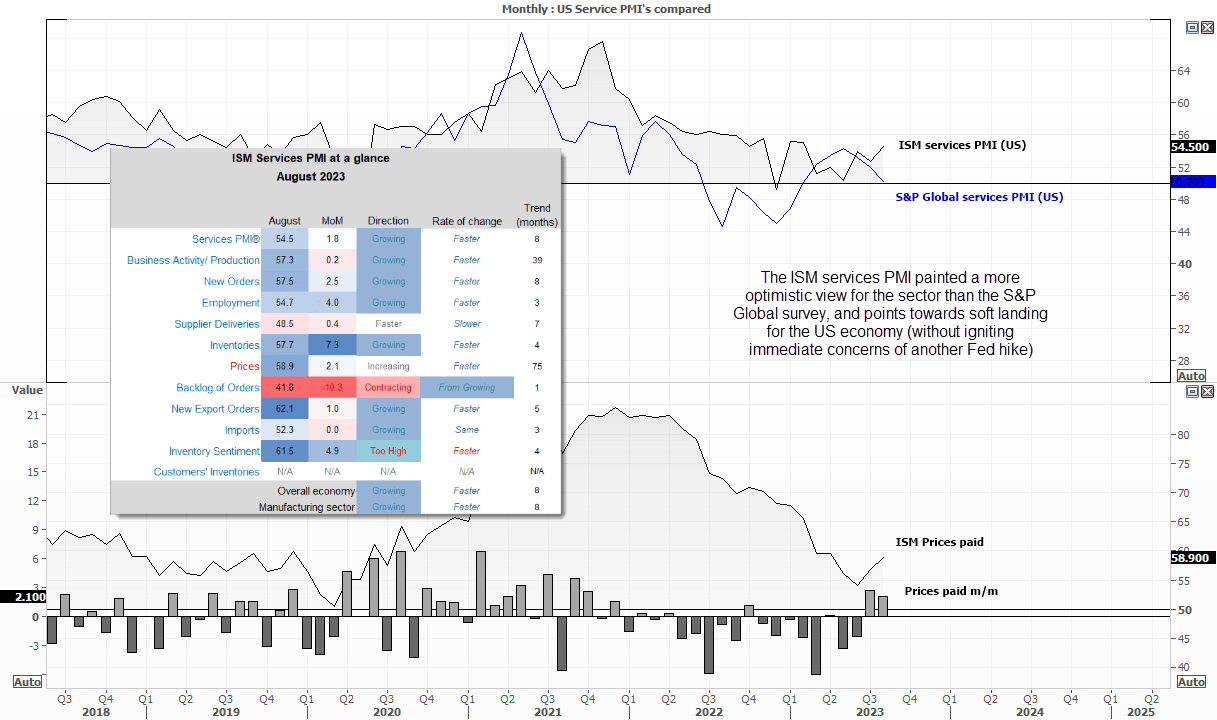
Two key service PMI reports for the US diverged, with the S&P global reporting a minor expansion whilst the ISM painted a more optimistic picture. The ISM services PMI grew at its fastest pace in six month, 13/18 industries reported an expansion and the headline print if 54.5 indicates an annualised GDP rate of 1.6%. The employment index rose to a 21-month high and new orders hit a 6-month high, although prices paid also increased for a second month. Comments from the survey respondents also seemed to back up a soft landing scenario for the US economy, and Fed fund futures continues to imply that the Fed are done with hiking.
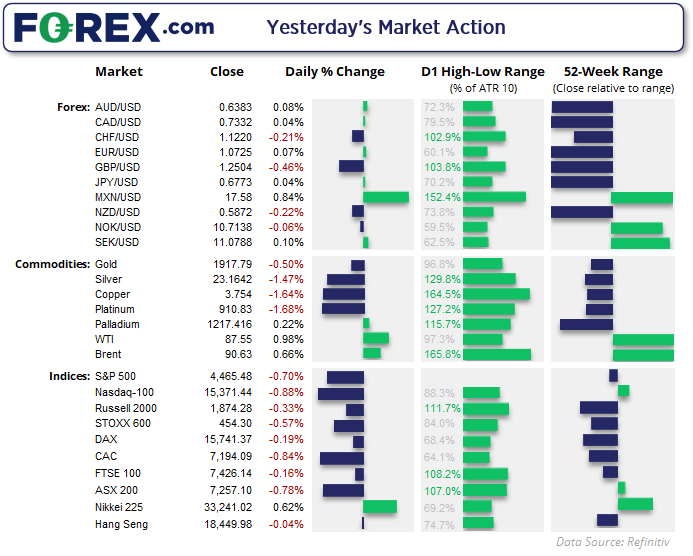
- US bond yields rose for a third day and Wall Street indices pulled back further as the ISM report plays into the ‘higher for longer’ narrative for Fed rates
- The S&P 500 pulled back to 4450 during its worst day in eight, the Nasdaq also retreated but found support at the 24 August high
- USD/CNH rallied for a second day and saw a nice break out of the 1-hour bull flag to exceed the lower target of 7.32. Although reports that China’s state banks were actively selling USD/CNH saw the pair hand back around half of the day’s gains
- GBP/USD fell to a 3-month low and was the weakest forex major on Wednesday as BOE governor Bailey said that the central bank was “much nearer” the end of its tightening cycle. This followed on from last week’s comments from the BOE’s chief economists that rates are more likely to plateau
- WTI crude oil rose for a sixth day and held on to gains on a report that crude inventories had dropped for a fourth week
- The Bank of Canada held rates as anticipated but warned that they could hike again of inflationary pressures persist.
- ECB member Knot said that markets are underestimating the risks for further ECB hikes
Events in focus (AEDT):
- 11:30 – Australian trade balance, building approvals
- 11:30 – BOJ board member Nakagawa speaks, so traders should at least be on guard for further comments on yen given officials such as currency diplomat Kanda are beginning to make more noise
- 13:00 – China’s trade balance data is not expected to wow us given the increasingly negative numbers it has produced in recent months. But the consensus is for those declines to slow, but if we are to see a surprise that is meaningful to markets it likely needs to be to the upside – not the downside.
- 16:00 – German industrial production
- 18:30 – ECB's Elderson Speaks
- 19:00 – European GDP, employment
- 22:30 – US jobless claims
ASX 200 at a glance:
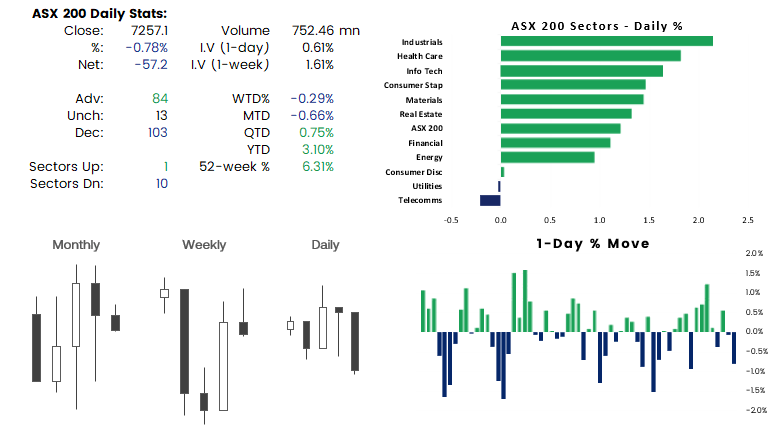
- The ASX 200 cash index suffered its worst day in seven and closed beneath its 4-day consolidation
- SPI futures fell -0.4% which points to a weak open for the cash index today
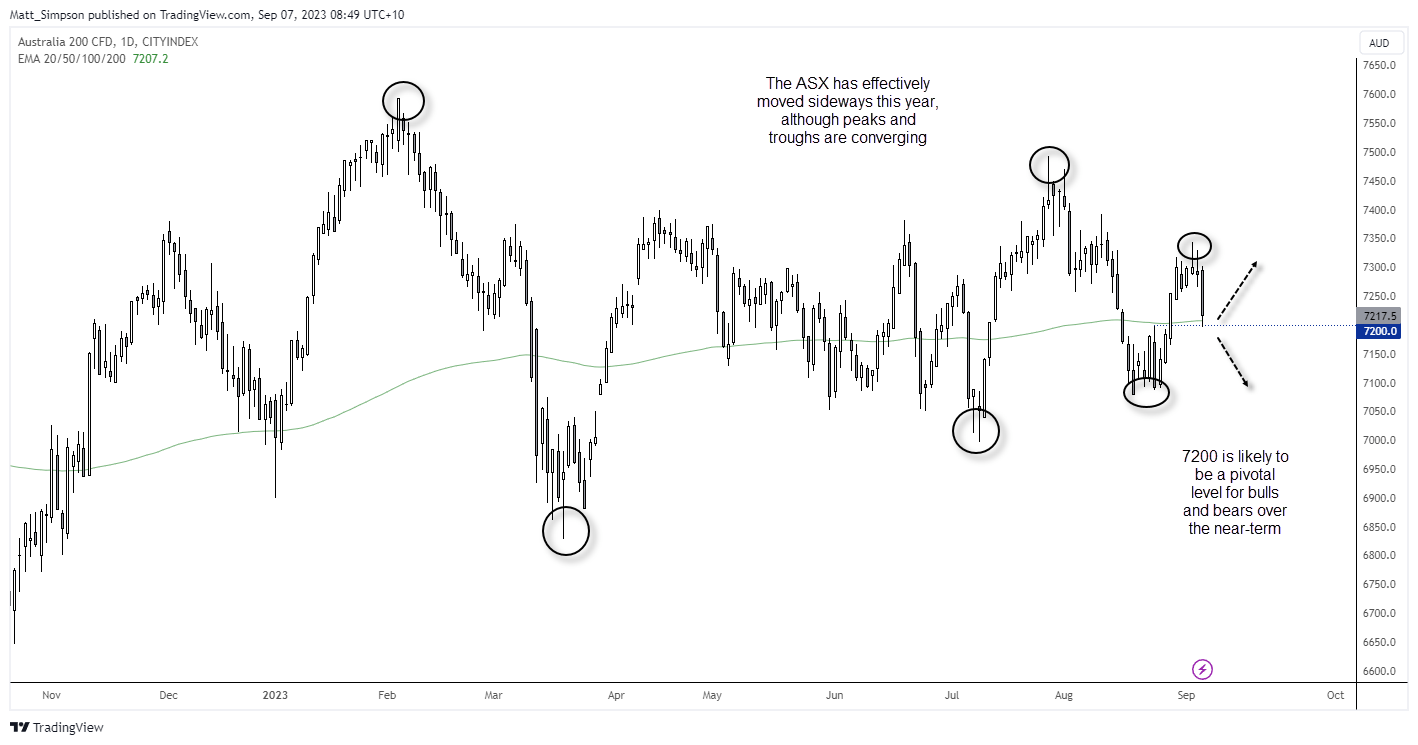
- The chart below shows that the ASX has effectively moved sideways this year, although its highs and lows have converged as volatility coils up
- This can be an indication that volatility will at some point explode, although it doesn’t provide a timely cue as to when
- However, momentum turned sharply lower yesterday and the ASX now clings to support around 7200 and the 200-day EMA – which is likely a pivotal area over the near-term
- Traders may want to keep an eye on global sentiment to get a feel for whether the ASX can scrape a bounce from the 7200, or seek to seek bearish bets with a break (or retest) beneath it
Dow Jones technical analysis (daily chart):
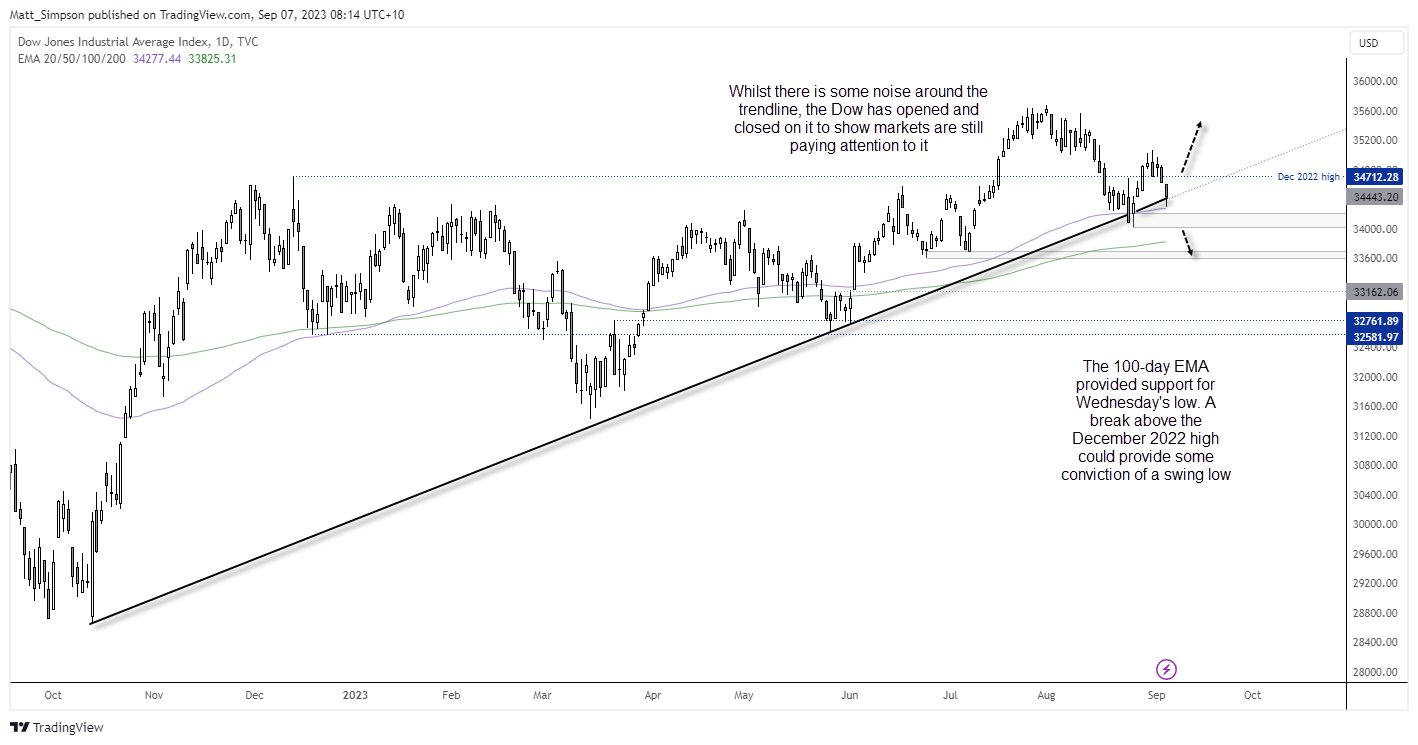
The Dow Jones tracked the S&P 500 and Nasdaq 100 lower, and finds itself approaching interest levels of support. Recent price action has generated some noise around the October trendline, and whilst it saw a daily close beneath it on 24 August we have since seen the market open and close on the trendline on 25 August and 6 September, meaning the trendline still has some relevance.
The 100-day EMA provided support for yesterday’s low, and the 100 remains above the 200-day EMA, so perhaps it has some fight left in it yet. Although I’d prefer to see it break back above the December 2022 high before regaining confidence a swing low has formed with a break above 35,070 being required to confirm a chance in trend (back to the bullish side). A move below 34,000 assumes the next leg lower is underway, although I’d expect the 200-day EMA around 33,840 to at least provide some initial support.
View the full economic calendar
-- Written by Matt Simpson
Follow Matt on Twitter @cLeverEdge


