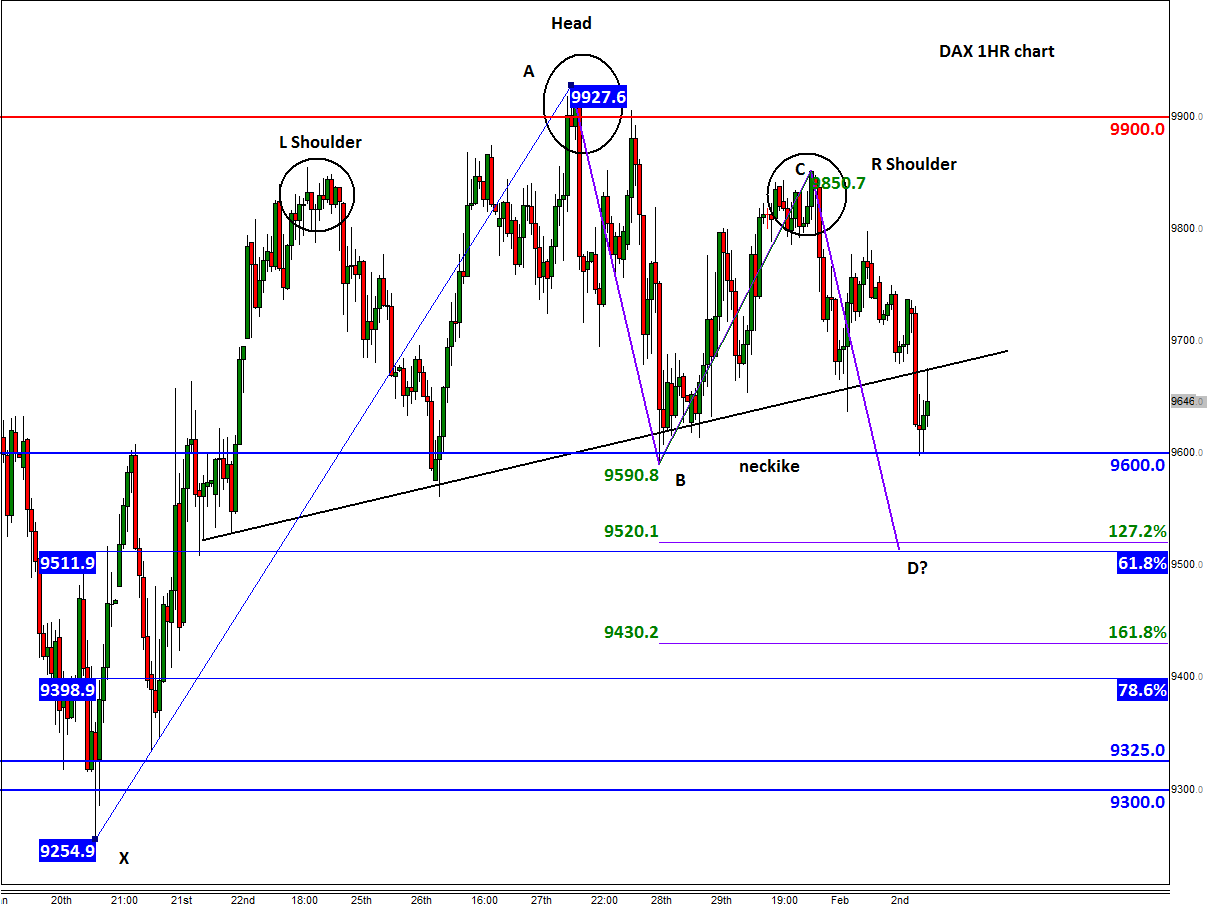
In a quick follow-up to our DAX report published on Friday (see "DAX: More weakness or rebound in February?" for more), the German benchmark stock index is currently displaying a bearish technical pattern on its intraday charts, which points to further losses in the near term.
As can be seen on the 1-hour chart, below, the DAX has formed a clear Head and Shoulders reversal pattern. It has already broken below a rising trend line, but as we went to press it was still above the neckline of the H&S around 9600. If this level breaks, it would validate the H&S pattern, and potentially lead to a big drop, with the initial target being around 9510/20 area.
But traders who look at the longer-term charts (such as those we published on Friday) will realise that the DAX may have already formed a base around the 9300/25 area.
Indeed, there is a possibility for a more significant bullish pattern to emerge around the first bearish target of 9510/20 area. This is where an ABCD pattern meets a couple of Fibonacci levels i.e. the 61.8% retracement of XA and 121.2% extension of BC price swings. In other words, a Bullish Gartley pattern could potentially form around this 9510/20 area. So, speculators may wish to keep a very close eye on this area, should we get there.
If, however, 9510/20 breaks decisively then the index could drop to the next Fibonacci-based targets as shown on the chart, or even go for a revisit of the 9300 area before deciding on its next move.
On the upside, a rally beyond the right shoulder (or point C of the ABCD pattern) at 9850 would invalidate the abovementioned bearish pattern. In this scenario, a follow-up rally above the key resistance level of 9900/30 would then become highly likely.
Figure 1:


