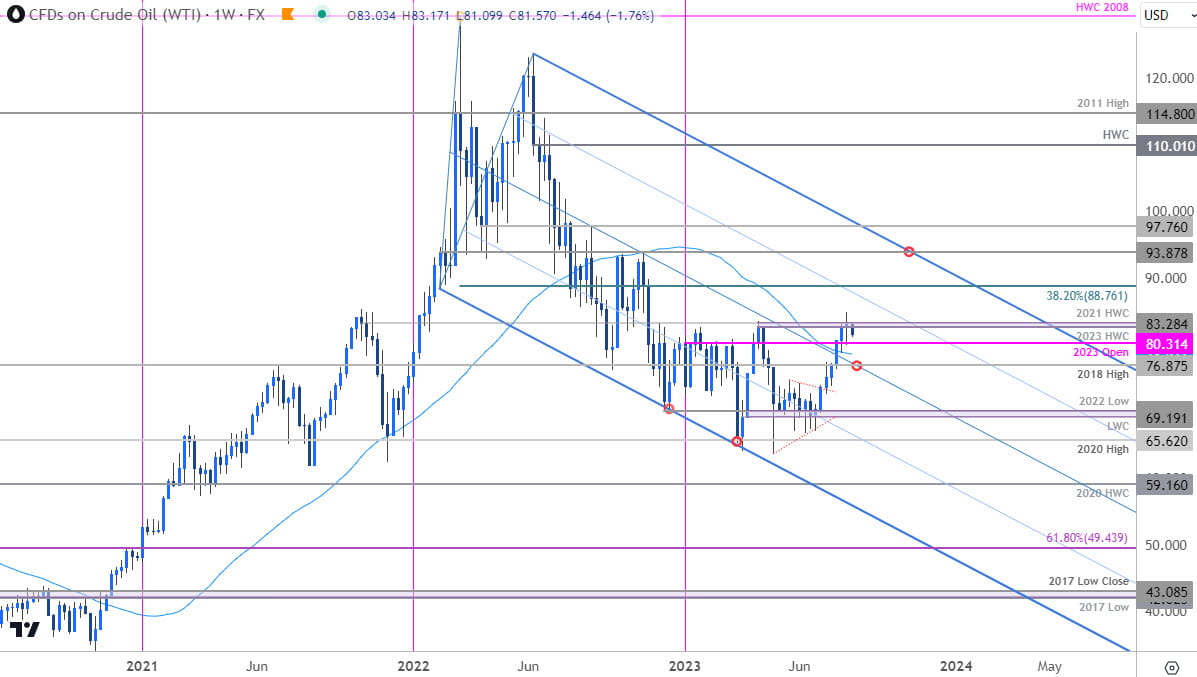
Crude Oil Technical Forecast: WTI Weekly Trade Levels
- Oil price breakout exhausts into key resistance at yearly high
- Crude rally vulnerable near-term, risk for correction pullback
- WTI resistance 82.68-83.28 (key), ~87, 88.76- support ~80.31, 78.57, 76.87
Crude oil prices surged more than 33.3% off the yearly lows with a stunning seven-week rally now vulnerable into key resistance at the yearly highs. While the medium-term outlook remains constructive, the advance may be vulnerable here and the focus is on this pullback off resistance. These are the updated targets and invalidation levels that matter on the WTI weekly technical chart.
Review my latest Weekly Strategy Webinar for an in-depth breakdown of this crude oil setup and more. Join live on Monday’s at 8:30am EST.
Crude Oil Price Chart – WTI Weekly

Chart Prepared by Michael Boutros, Technical Strategist; WTI on TradingView
Technical Outlook: In last month’s Crude Oil Price Forecast we noted that the WTI bulls had taken charge with a breakout of a multi-month consolidation pattern, “approaching a cluster of key technical considerations and the first real test for the bulls.” We specifically highlighted that, “a topside breach / close above the 2023/2021 high-week closes at 82.68-83.28 would be needed to suggest a larger trend reversal is underway and validate a breakout of the yearly opening-range.” Oil briefly registered an intra-day high at 84.87 last week before exhausting with price unable to mark a weekly close above this key pivot zone- risk for near-term exhaustion.
Initial support rests with the yearly open at 80.31 backed closely by the 52-week moving average (currently ~78.57) and the 2018 swing high at 76.87. Note that losses below the median-line could fuel a bout of accelerated losses and we’ll reserve this threshold as our medium-term bullish invalidation level.
A topside breach / close above 83.28 exposes subsequent resistance objectives at the 75% parallel (currently ~87) and the 38.2% retracement of the 2022 decline at 88.76- look for a larger reaction there IF reached.
Bottom line: A stunning seven-week rally is vulnerable here into resistance at the yearly range-highs. From a trading standpoint, a good region to reduce portions of long-exposure / raise protective stops – losses should be limited to the median-line / 76.87 IF price is heading higher on this stretch with a weekly close above 83.28 needed to mark resumption. I’ll publish an updated Crude Oil Short-term Outlook once we get further clarity on the near-term WTI technical trade levels.
Active Weekly Technical Charts
- US Dollar (DXY)
- Gold (XAU/USD)
- Euro (EUR/USD)
- Canadian Dollar (USD/CAD)
- British Pound (GBP/USD)
- Australian Dollar (AUD/USD)
--- Written by Michael Boutros, Sr Technical Strategist with FOREX.com
Follow Michael on Twitter @MBForex


