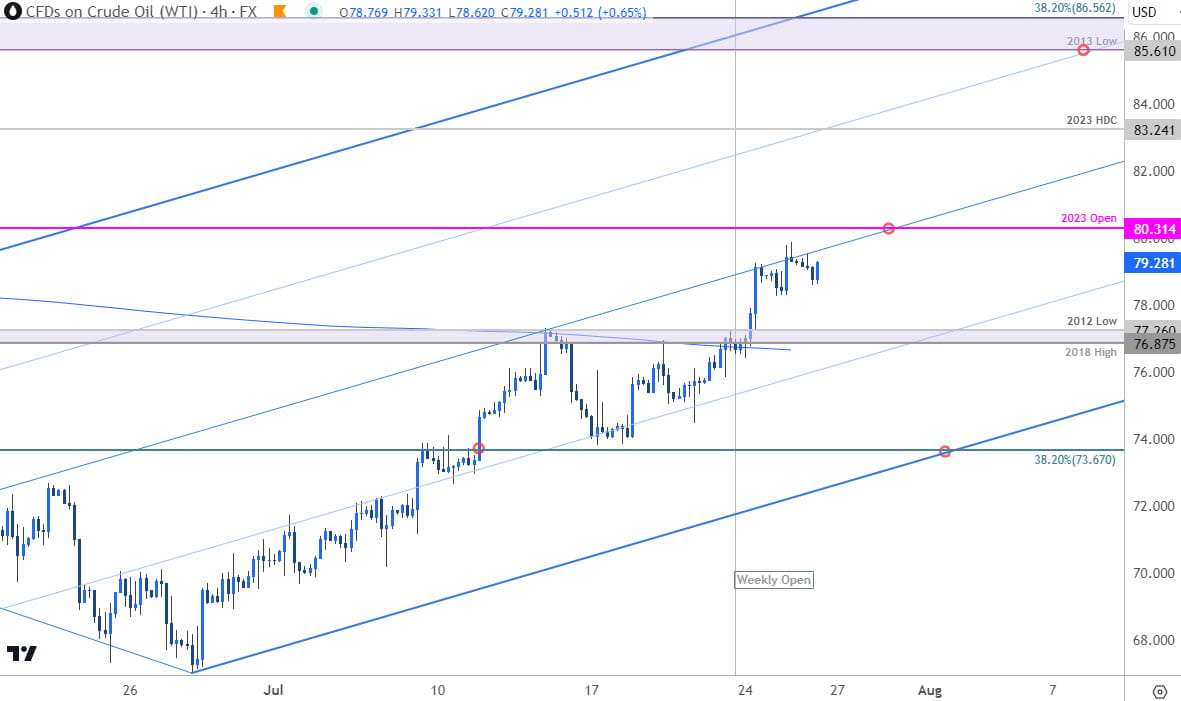
Crude Oil Technical Outlook: WTI Short-term Trade Levels
- Oil breakout attempting fifth daily advance to mark a fifth-weekly rally
- Crude prices now approaching key technical hurdle into 2023 yearly open
- WTI resistance 80.31, 83.24, 85.61-86.56- support ~76.63-77.26, 73.67 (key), 68.59
Crude oil prices surged more than 25% off the yearly lows with the bulls attempting a five-day rally within a broader five-week advance. The WTI breakout takes price back above the 200-day moving average for the first time in nearly a year and threatens a larger shift in the broader technical outlook. These are the updated targets and invalidation levels that matter on the short-term WTI technical charts.
Review my latest Weekly Strategy Webinar for an in-depth breakdown of this crude oil setup and more. Join live on Monday’s at 8:30am EST.
Crude Oil Price Chart – WTI Daily

Chart Prepared by Michael Boutros, Technical Strategist; WTI on TradingView
Technical Outlook: Crude oil broke above a key pivot zone on Monday at 76.87-77.26- a region defined by the 2018 high and the 2012 swing low. A four-day advance takes WTI into uptrend resistance at the median-line of the ascending pitchfork extending off the yearly lows with yearly-open resistance just higher at 80.31- looking for a reaction into this threshold IF reached.
Crude Oil Price Chart – WTI 240min

Chart Prepared by Michael Boutros, Technical Strategist; WTI on TradingView
Notes: A closer look at oil prices shows WTI testing uptrend resistance here with the rally marking momentum divergence on numerous timeframes. Initial support rests back at 76.87-77.26 with near-term bullish invalidation now raised to the 38.2% retracement / lower parallel around 73.67- note that losses below this threshold could fuel another accelerated decline back towards the July-open at 70.39 and beyond.
A topside breach / close above 80.31 is needed to fuel the next leg higher towards the yearly / April high-day close at 83.24 and the next major pivot zone near 85.61-86.56 – a region defined by the 2013 low and the 38.2% Fibonacci retracement of the 2022 decline. A weekly close above this threshold would validate a breakout of the objective 2023 opening-range and would have larger implications heading into the close of the year.
Bottom line: A breakout of a multi-month consolidation pattern takes crude prices into the yearly-open at uptrend resistance. From a trading standpoint, a good zone to reduce portions of long-exposure / raise protective stops – losses should be limited to the 200DMA on pullbacks IF price is heading higher on this stretch. Ultimately, a larger pullback may offer more favorable entries closer to trend support. Review my latest Crude Oil Weekly Technical Forecast for a closer look at the longer-term WTI trade levels.
Active Short-term Technical Charts
- US Dollar Short-term Outlook: Fed Countdown- USD Battle Lines Drawn
- Australian Dollar Short-term Outlook: AUD/USD Snap Back
- Euro Short-term Outlook: EUR/USD Eight-day Rally at Resistance
- Japanese Yen Short-Term Technical Outlook: USD/JPY Free-Falling
- Gold Short-term Price Outlook: XAU/USD Moment of Truth at Key Support
- Canadian Dollar Short-term Outlook: USD/CAD Grinds at Resistance into Q3
--- Written by Michael Boutros, Sr Technical Strategist with FOREX.com
Follow Michael on Twitter @MBForex


