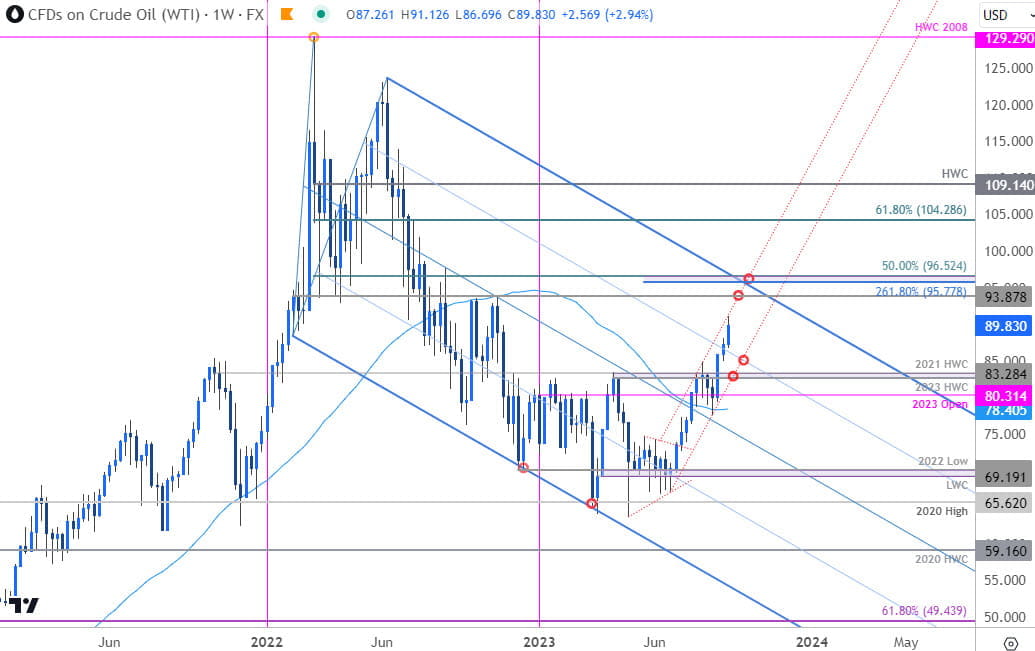
Crude Oil Technical Forecast: WTI Weekly Trade Levels
- Oil prices breakout of 2023 yearly opening-range on three-week rally
- Crude rally approaching trend resistance, threat for possible exhaustion ahead
- WTI Resistance 91.40s, 93.88, 95.77-96.52 (key)- Support ~85, 82.68-83.28, 80.31
Crude oil prices have now surged more than 43.2% off the yearly lows with a breakout in WTI pressing fresh yearly highs this week. The outlook remains constructive with the bulls within striking distance of multi-year trend resistance. These are the updated targets and invalidation levels that matter on the WTI weekly technical chart.
Review my latest Weekly Strategy Webinar for an in-depth breakdown of this crude oil setup and more. Join live on Monday’s at 8:30am EST.
Crude Oil Price Chart – WTI Weekly

Chart Prepared by Michael Boutros, Technical Strategist; WTI on TradingView
Technical Outlook: In last month’s Crude Oil Price Forecast we noted that a seven week rally in WTI was vulnerable, “into resistance at the yearly range-highs. From a trading standpoint, a good region to reduce portions of long-exposure / raise protective stops – losses should be limited to the median-line / 76.87 IF price is heading higher on this stretch with a weekly close above 83.28 needed to mark resumption.” Oil prices held resistance for more than three-weeks with WTI registering an intra-week low at 77.57 before reversing sharply higher.
A three-week rally of nearly 17.5% now takes price into uptrend resistance at the upper bounds of the ascending July channel (currently ~91.40s). The immediate upside may be limited here near-term, but the focus remains weighted to the topside while within this formation. Initial support is eyed at the highlighted trendline confluence near the 85-handle and is backed by the April & 2021 high-week closes at 82.68-83.28- losses should be limited to this threshold IF price is heading higher on this stretch.
The next major resistance objectives are eyed at 93.87 and 95.78-96.52- a region defined by the 2.618% of the May advance and the 50% retracement of the 2022 decline. A breach / weekly close above this threshold would be needed to invalidate the broader downtrend / fuel the next leg higher towards 100 & 104.28.
Bottom line: A breakout of the yearly opening-range keeps the broader outlook weighted to the topside in oil prices- that said, the advance is now approaching more significant technical resistance just higher. From a trading standpoint, look to reduce portions of long-exposure / raise protective stops on a stretch towards the 96-handle – losses should be limited to channel support IF the bulls are going to make a run-on trend resistance. I’ll publish an updated Crude Oil Short-term Outlook once we get further clarity on the near-term WTI technical trade levels.
Active Weekly Technical Charts
- US Dollar (DXY)
- Gold (XAU/USD)
- Euro (EUR/USD)
- Canadian Dollar (USD/CAD)
- British Pound (GBP/USD)
- Australian Dollar (AUD/USD)
- Japanese Yen (USD/JPY)
--- Written by Michael Boutros, Sr Technical Strategist with FOREX.com
Follow Michael on Twitter @MBForex


