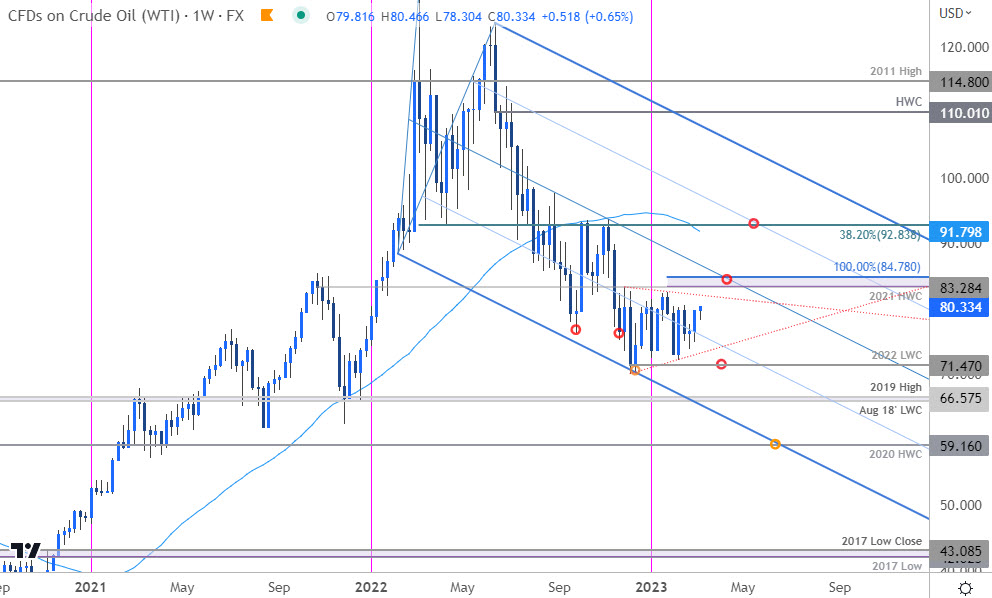
Crude Oil technical forecast: WTI weekly trade levels
- Crude prices in multi-month consolidation – breakout pending
- Oil rally approaching 2023 opening-range highs
- WTI resistance 81.90s, 83.28-84.78 (key), 92.83– support 73.40s, 71.47 (key), 66
Crude oil prices have carved a well-defined yearly opening-range with WTI poised for a breakout in the weeks ahead. These are the updated targets and invalidation levels that matter on the WTI weekly technical chart.
Discuss this crude oil setup and more in the Weekly Strategy Webinars on Monday’s at 8:30am EST.
Crude Oil Price Chart – WTI Weekly

Chart Prepared by Michael Boutros, Technical Strategist; WTI on TradingView
Technical Outlook: Crude oil prices rebounded sharply off downtrend support (blue) in December of last year with a 17.9% rally off the lows failing in late-January. Since then, WTI has continued to trade within the confines of a massive multi-month consolidation pattern – we’re looking for the breakout to offer some guidance here in the weeks ahead.
Initial resistance stands with the December trendline (red- currently ~81.90s) backed by 83.28-84.78 – a region defined by the 2021 high-week close and the 100% extension of the late-December advance. A breach / weekly close above this threshold is needed to suggest a more significant low was registered last year and would expose initial resistance objectives at the 52-week moving average (currently ~91.80s) and the 38.2% Fibonacci retracement of the 2022 decline at 92.83.
Initial support rests with lower bounds (currently ~73.40s) with a break / weekly close below the 2022 low-week close at 71.47 needed to mark resumption of the broader downtrend towards the August 2018 low-week close / 2019 high at 65.92-66.57 and the lower parallel / 2020 high-week close at 59.16.
Bottom line: Oil prices are in consolidation just above downtrend support- breakout pending. From at trading standpoint, look to reduce long-exposure / raise protective stops on a stretch towards the median-line – losses should be limited to 71.47 IF price is indeed heading higher. I’ll publish an updated crude oil short-term outlook once we get further clarity on the near-term WTI technical trade levels.
Active Weekly Technical Charts
- Gold (XAU/USD)
- S&P 500 (SPX500)
- US Dollar Index (DXY)
- British Pound (GBP/USD)
- Australian Dollar (AUD/USD)
- Japanese Yen (USD/JPY)
- Canadian Dollar (USD/CAD)
- Euro (EUR/USD)
--- Written by Michael Boutros, Sr Technical Strategist with FOREX.com
Follow Michael on Twitter @MBForex


