- Crude oil, Hang Seng futures and the Chinese yuan have been strengthening recently, reversing prior losses
- While hopes for a soft landing may explain the strength, price signals from the charts are arguably just as influential
Overview
For all the fundamental reasons put forward to explain their day-to-day gyrations, one look at price action suggests technical factors are arguably just as important in determining movements in the likes of Hong Kong’s Hang Seng, USD/CNH and crude oil. With each of these markets near important levels, we look at the price signals to evaluate where their directional risks lie.
Hang Seng: looking to buy near-term dips

The Hang Seng has been on a bullish run recently, adding close to 1500 points over the past seven sessions. While nearing overbought territory on RSI (14), with that indicator continuing to trend higher and with MACD confirming the bullish signal on momentum, buying dips is preferred to selling the rip in the near-term.
On the downside, the price had a look at the August 30 high of 18160 during today’s session before reversing higher, suggesting that may be a level to initiate longs should the price return there. On the topside, 18476 and 18766 are the initial levels of note, with a break above the latter opening the door for a retest of the May high at 19559.
If the price were to break and close below 18160, the bullish bias would be invalidated.
Crude oil breaks back into uptrend

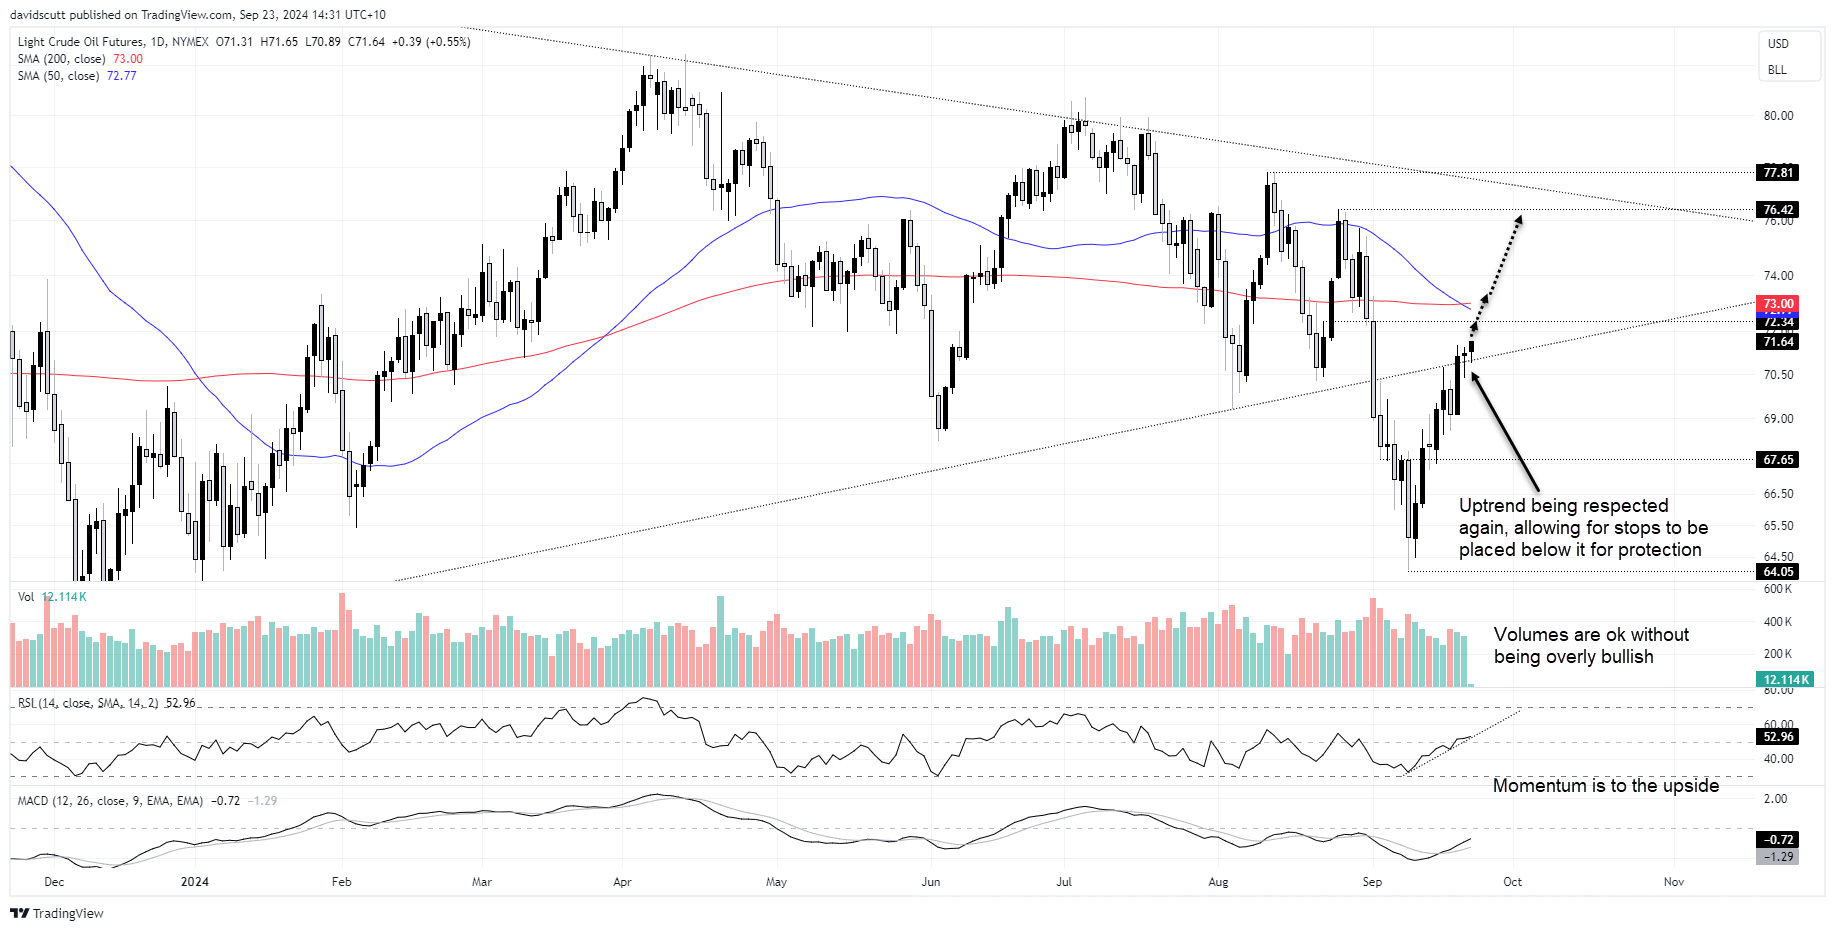
For all the doom and gloom about the demand outlook, crude oil has surged over 10% from the recent lows, sending the WTI contract back above the uptrend dating back to May 2023. The fact we’ve seen two bounces from this level over the past two sessions following the bullish break suggests it’s still highly relevant for traders, creating a level to potentially build setups around.
With MACD and RSI (14) providing bullish signals on momentum, upside is favoured over downside in the near-term, putting a potential retest of minor resistance at $72.34 on the table. From there, a tougher test awaits with the 50 and 200-day moving averages just above. If they were to break convincingly, we could be looking at a runup towards $76.42 or even major downtrend resistance just above $77.
Those keen to take on the long trade could buy around these levels or wait for a potential pullback towards the uptrend, allowing for a tight stop to be placed beneath it for protection.
USD/CNH moving lower with momentum

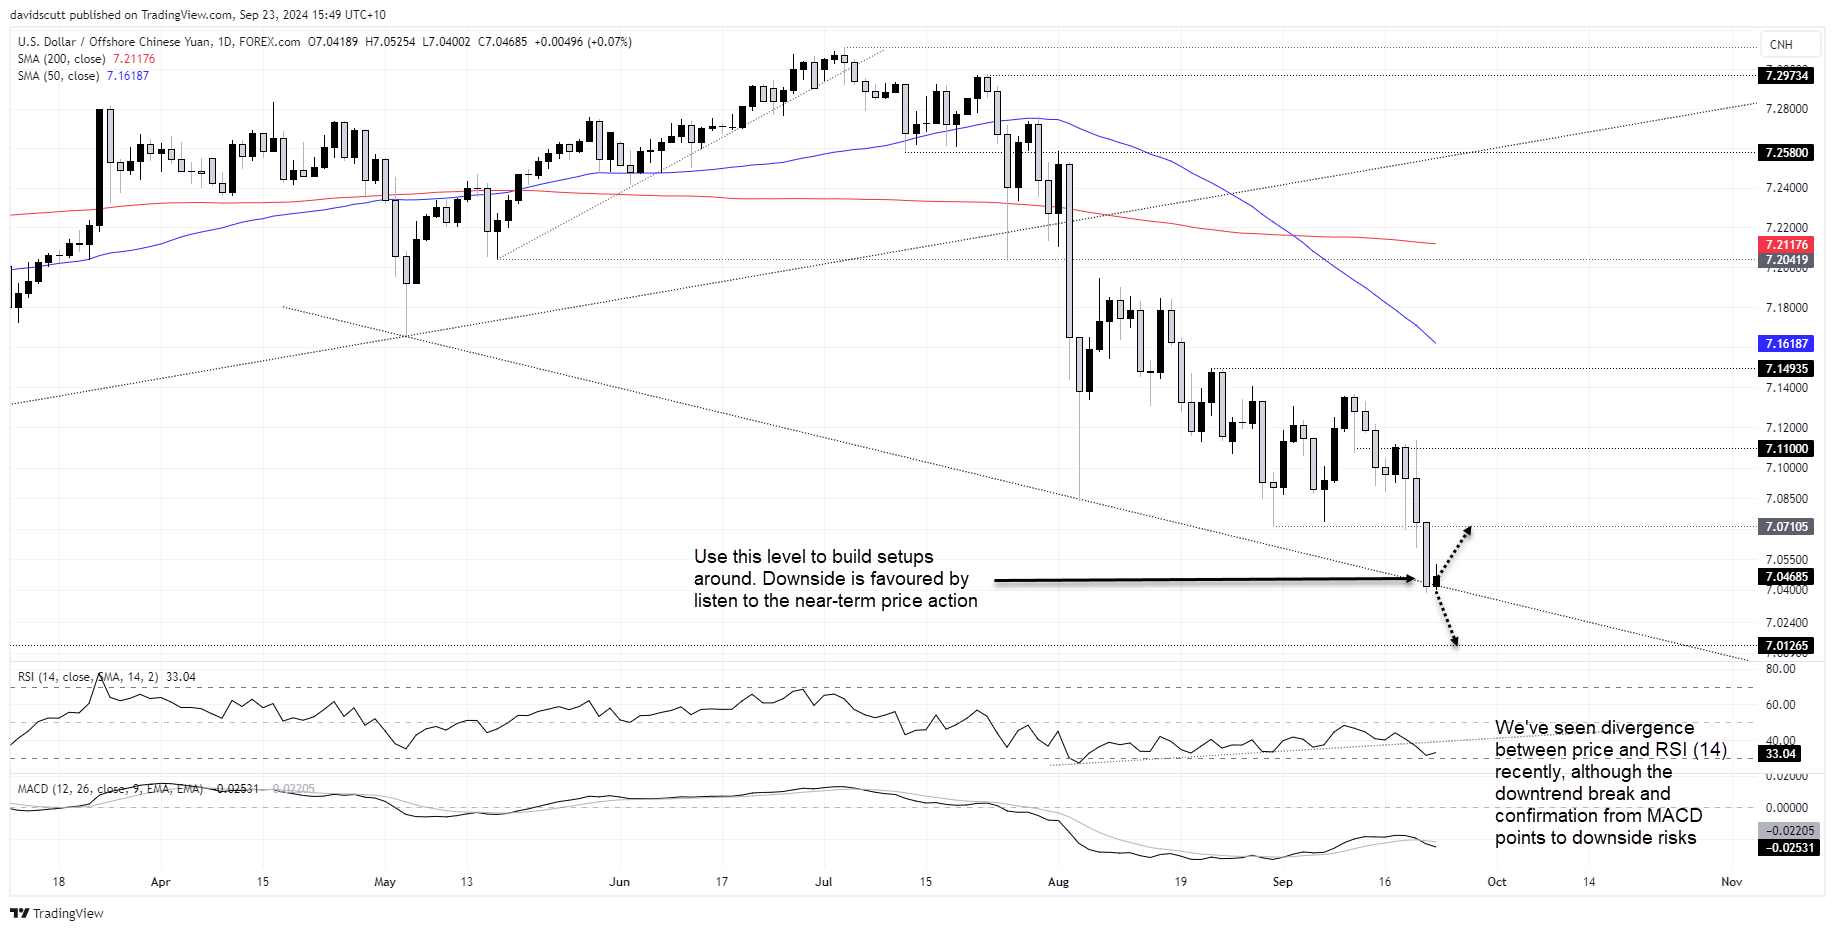
Despite persistent weakness in Chinese economic data and a 10-basis point reduction to the People’s Bank of China’s (PBoC) 14-day reverse repo rate on Monday, USD/CNH continues to decline, reacting more to the shifting interest rate outlook in the United States than any domestic factors.
After a false break last Thursday, USD/CNH broke and held below 7.07015 on Friday, closing at levels not seen since May 2023. Even though we’re witnessing divergence between RSI (14) and price, with the former breaking its downtrend convincingly last week and MACD confirming the bearish signal on momentum, USD/CNH comes across as a sell-on-rallies play.
Right now, it’s testing downtrend support dating back to May 3, with a break below this opening the door for a potential retest of 7.01265, a level that acted as both support and resistance in late 2022. Those keen to aid the bearish move could sell a potential break with a stop above the downtrend for protection targeting 7.01265.
While a downside break is favoured, if the price were unable to break and close below 7.0400 you could buy with a tight stop below the level for protection. Potential targets include 7.07105, 7.11000 and 7.14935.
-- Written by David Scutt
Follow David on Twitter @scutty


