- US OIL breaks below the key 80 level
- UK OIL breaks below the key 83.70 level
- US Dollar stabilizes above the 104 support
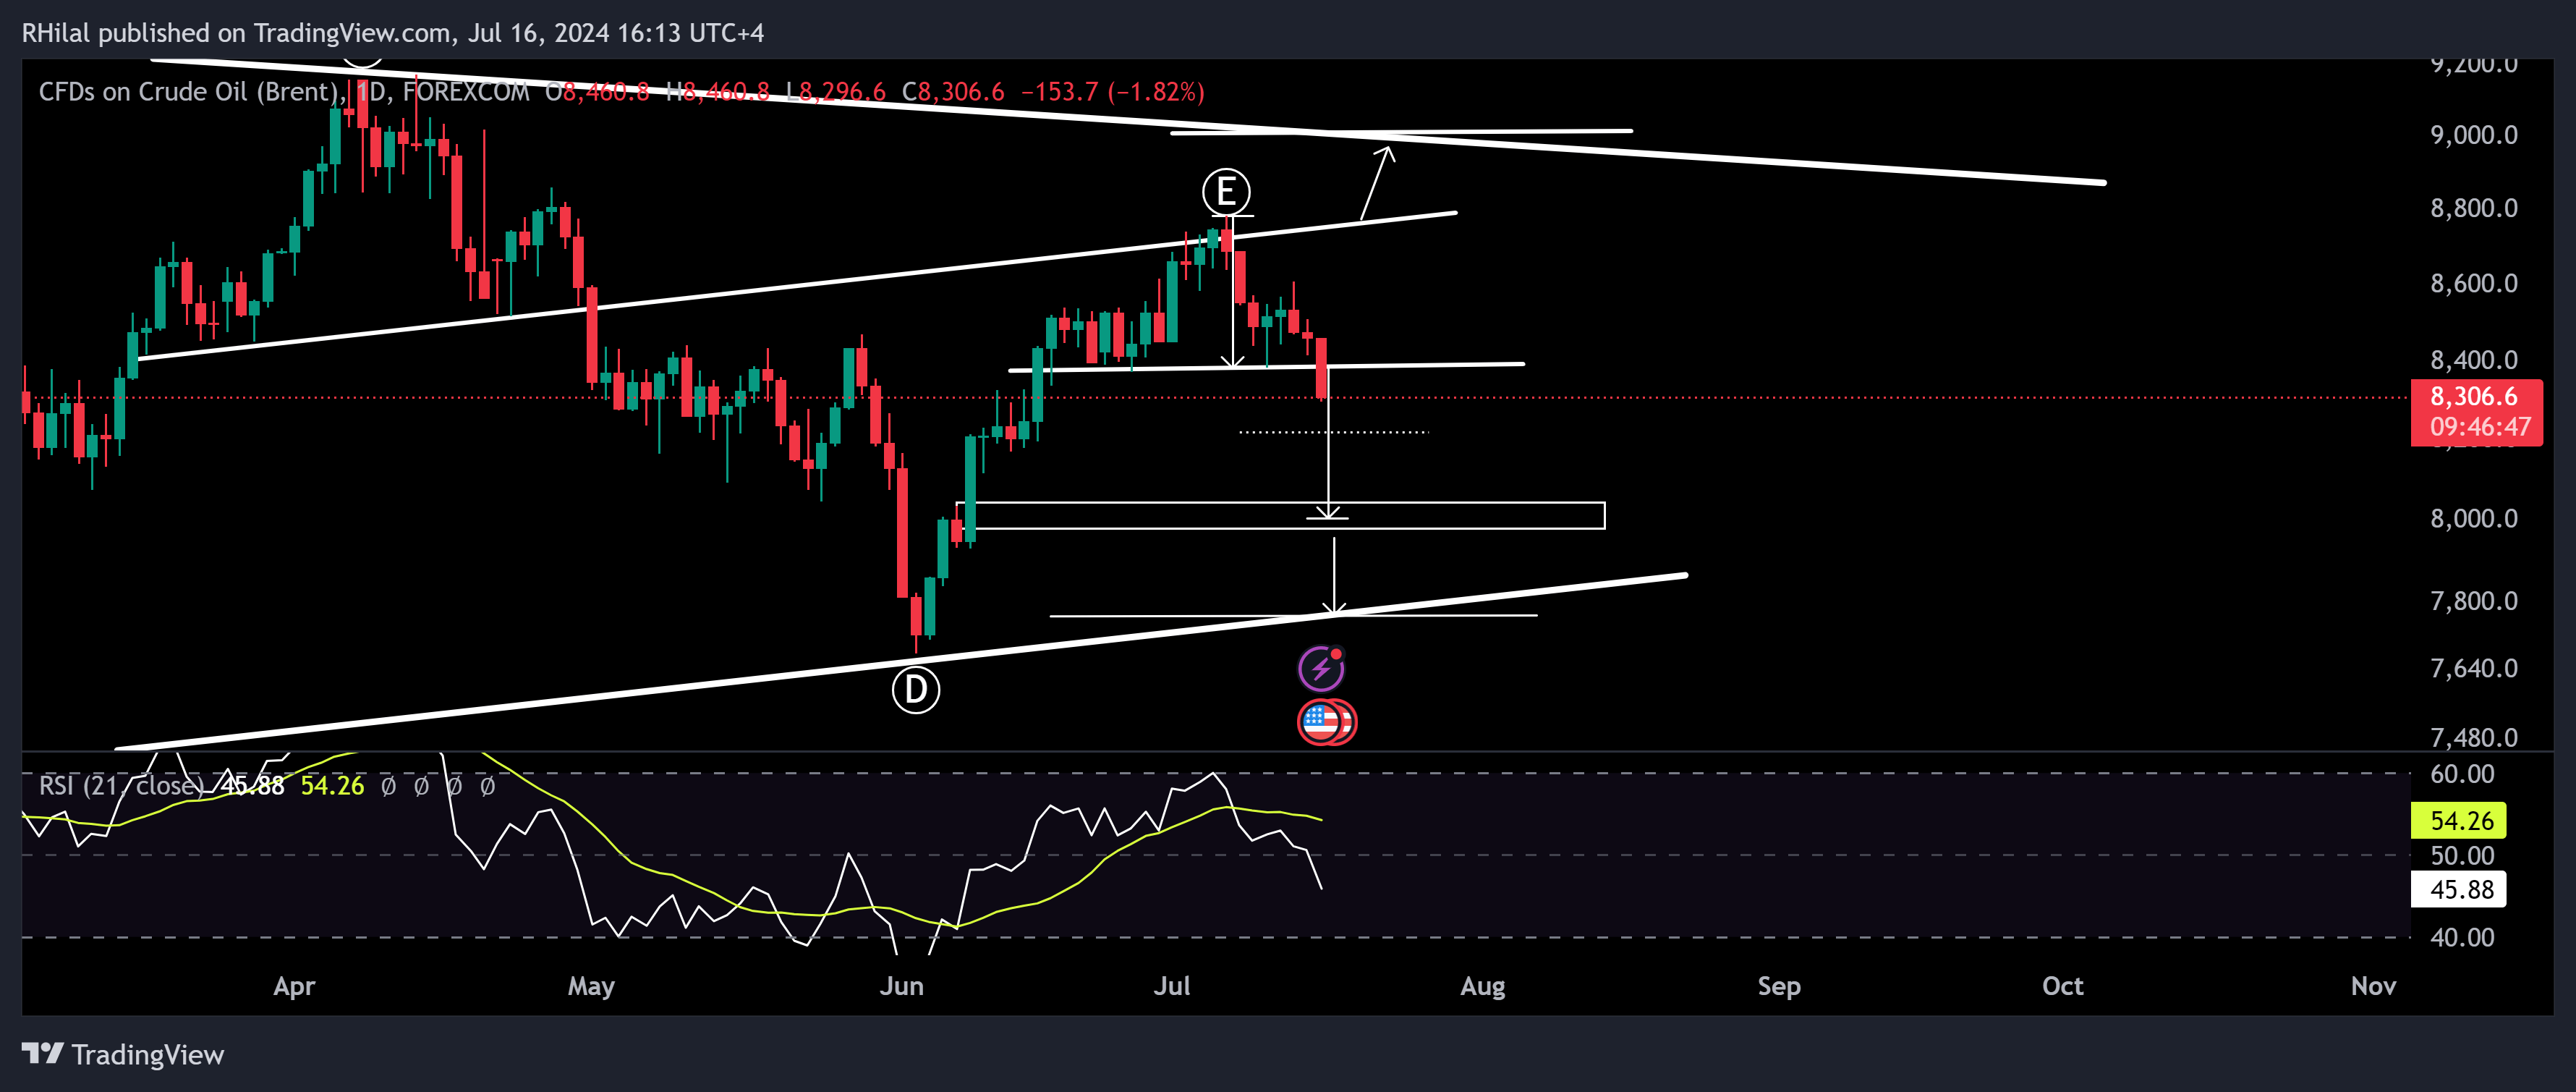
Crude Oil Analysis: UKOIL – Daily Time Frame – Log Scale:

Source: Trading view
Analyzing the UK Oil trends on a daily timeframe, the trendline supporting the lows from June 18 to July 16 has been breached, indicating a likely head and shoulders reversal pattern. This pattern targets a potential decline towards the support levels of 82.30 and 80. Further drops may find support near the 77.70 area.
From a Relative Strength Index (RSI) perspective, the break below the neutral 50 level supports the anticipated decline in oil prices for the week.
On the upside, a close above the 87.80 high could encounter resistance around the 90 level.
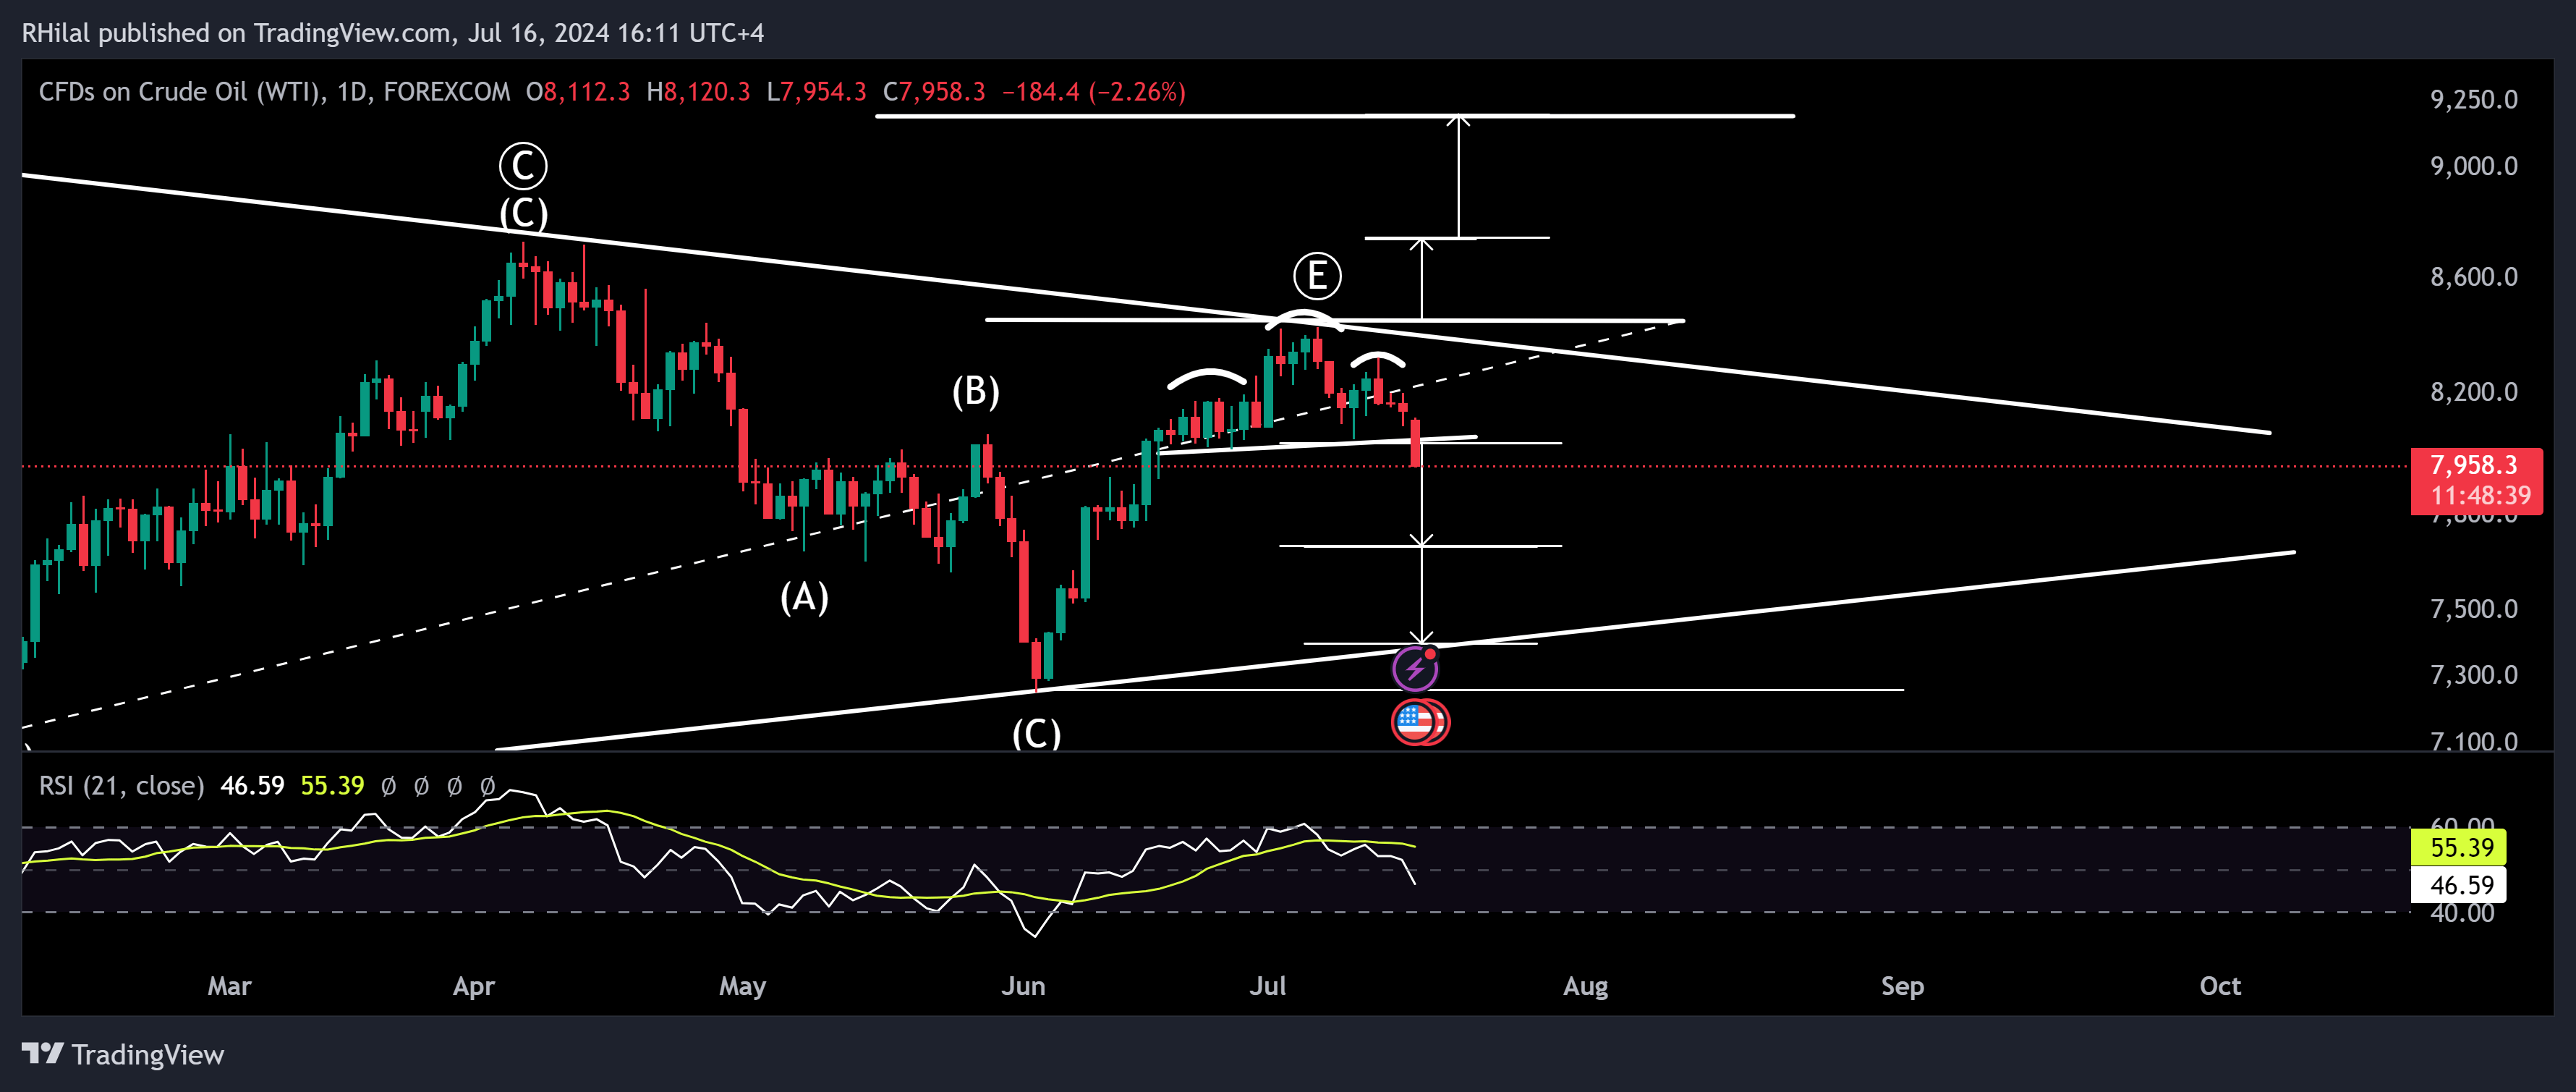
Crude Oil Analysis: USOIL – Daily Time Frame – Log Scale

Source: Tradingview
The key 80 support level has been breached on the US OIL chart, suggesting a possible head and shoulders formation on the daily US oil chart. This pattern targets a continued downtrend, with potential support levels at 77 and further down towards 74.
The RSI break below the neutral 50 level further supports the expected decline in oil prices for the week.
On the upside, a climb back above the 84 level could reverse the bearish momentum, with resistance expected at 87.30 and 92.
--- Written by Razan Hilal, CMT


