On Wednesday, the US will release the December Consumer Price Index (CPI). The headline print is expected to be the highest in 40 years at 7.0% YoY (some forecasts are higher) vs a 6.8% YoY reading in November. The Core CPI print for December, which excludes food and energy, is expected to be 5.4% YoY vs 4.9% YoY in November.
Prices on everything from housing to automobiles to appliances have been going through the roof lately! What began as the Fed increasing money supply and dropping interest rates to help businesses and families get through the pandemic, has turning into a spending spree. And why not? People and companies have more money, thus creating more demand, so businesses will charge higher prices. Higher demand equals higher inflation.
But demand isn’t the only reason inflation is surging. As a result of the pandemic, factories throughout the supply change were shut down (for various periods of time). Now, as demand has picked up, everyone in the supply chain is struggling to get what they need to produce their products. Less supply equals higher inflation.
All this inflation has put pressure on the Fed, which targets 2% for inflation. Until Fed Chairman Jerome Powell’s last testimony, the Fed had insisted that the recent high inflation was transitory. However, their tune has changed. At the last FOMC meeting on December 15th, 2021, FOMC members moved from ending bond purchases in June to ending them in March. In addition, the dot plots moved from forecasting 1 rate hike in 2022 to forecasting 3! And markets are currently pricing in 4 by the end of the year! As a result of the now hawkish Fed, 10-year yields reached 1.808%, the highest level since January 2020 (pre-pandemic).
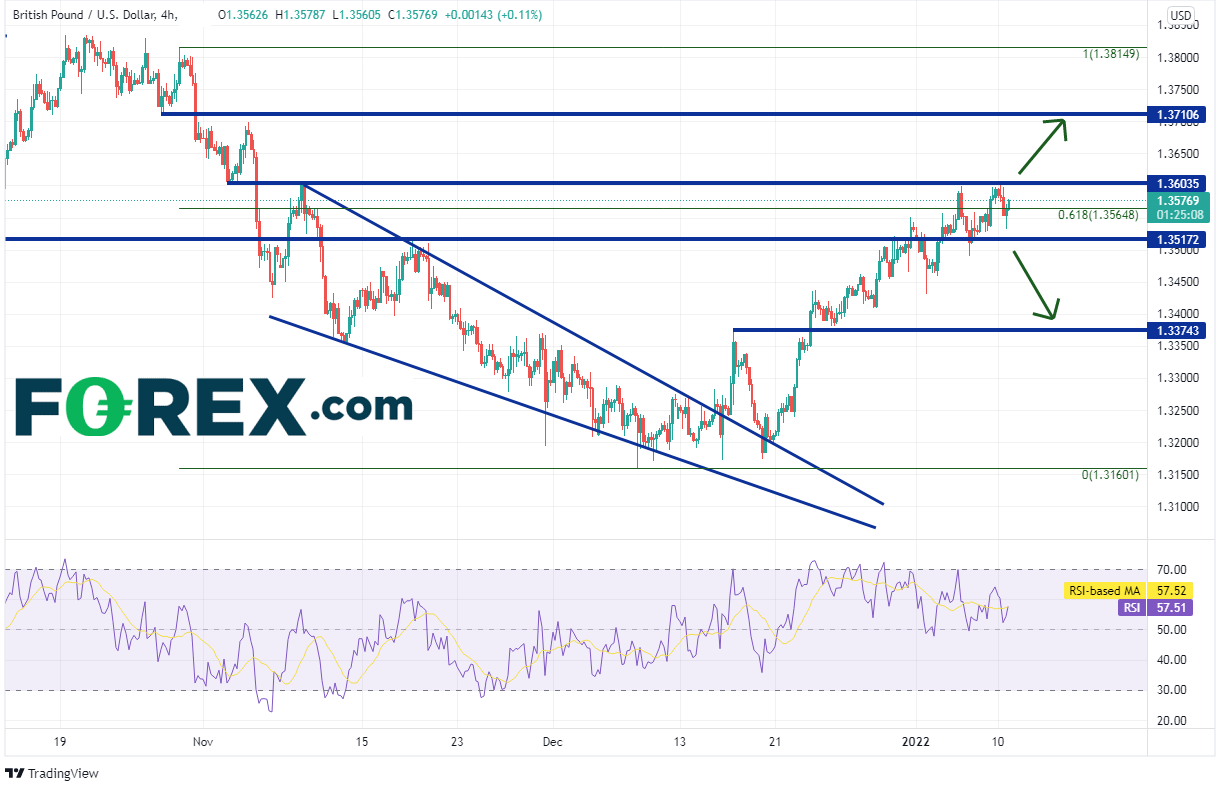
On December 15th, 2021, GBP/USD broke higher out of a descending wedge near 1.3250. One week later the pair pulled back to test the top trendline of the wedge near 1.3200. Support held and it was off to the races for GBP/USD. In one month, the pair gained 400 pips to 1.3603, retracing the entire wedge. Price is currently hovering near the 61.8% Fibonacci retracement level from the highs of October 28th, 2021 to the lows of December 8th, 2021, near 1.3565.

Source: Tradingview, Stone X
If CPI comes in hotter than expected, watch for GBP/USD to give back some of those gains. Good horizontal support below is at 1.3375. If CPI comes in under 7%, watch for GBP/USD to continue moving higher. Resistance above is at 1.3711.
Markets are looking for a 7% print for CPI on Wednesday, which would be the highest in 40 years. The Fed is hoping for less, as a plateau would give them some breathing room on tapering and/or hiking rates. Be ready for either result!


