Canadian Dollar, USD/CAD Talking Points:
- There’s been a fundamental deviation between the U.S. and Canada of late, with the Bank of Canada gearing up for rate cuts in June while the Federal Reserve continues to see strong U.S. data.
- USD/CAD has been very strong of late. I looked at the setup in the webinar three weeks ago, highlighting how the grindy price action in Q1 showed USD/CAD gaining acceptance above the 1.3500 handle. Since then, bulls have taken over with a major push after the US CPI report, and price in USD/CAD is now near resistance that’s held since Q4, 2022.
- I’ll be discussing these themes in-depth in the weekly webinar on Tuesday. It’s free for all to register: Click here to register.
USD/CAD remains in a range, and for a natural cross like USD/CAD that’s not all too extraordinary. In many cases if something positive happens for the U.S. then Canada can share some benefit; and vice versa. This isn’t all the time, of course, but when the USD is compared to a currency of an economy like Europe or Japan, the argument can be made that there’s far more similarity with Canada. And thus, ranges can form in currency pairs of natural crosses like USD/CAD or EUR/GBP or even AUD/NZD.
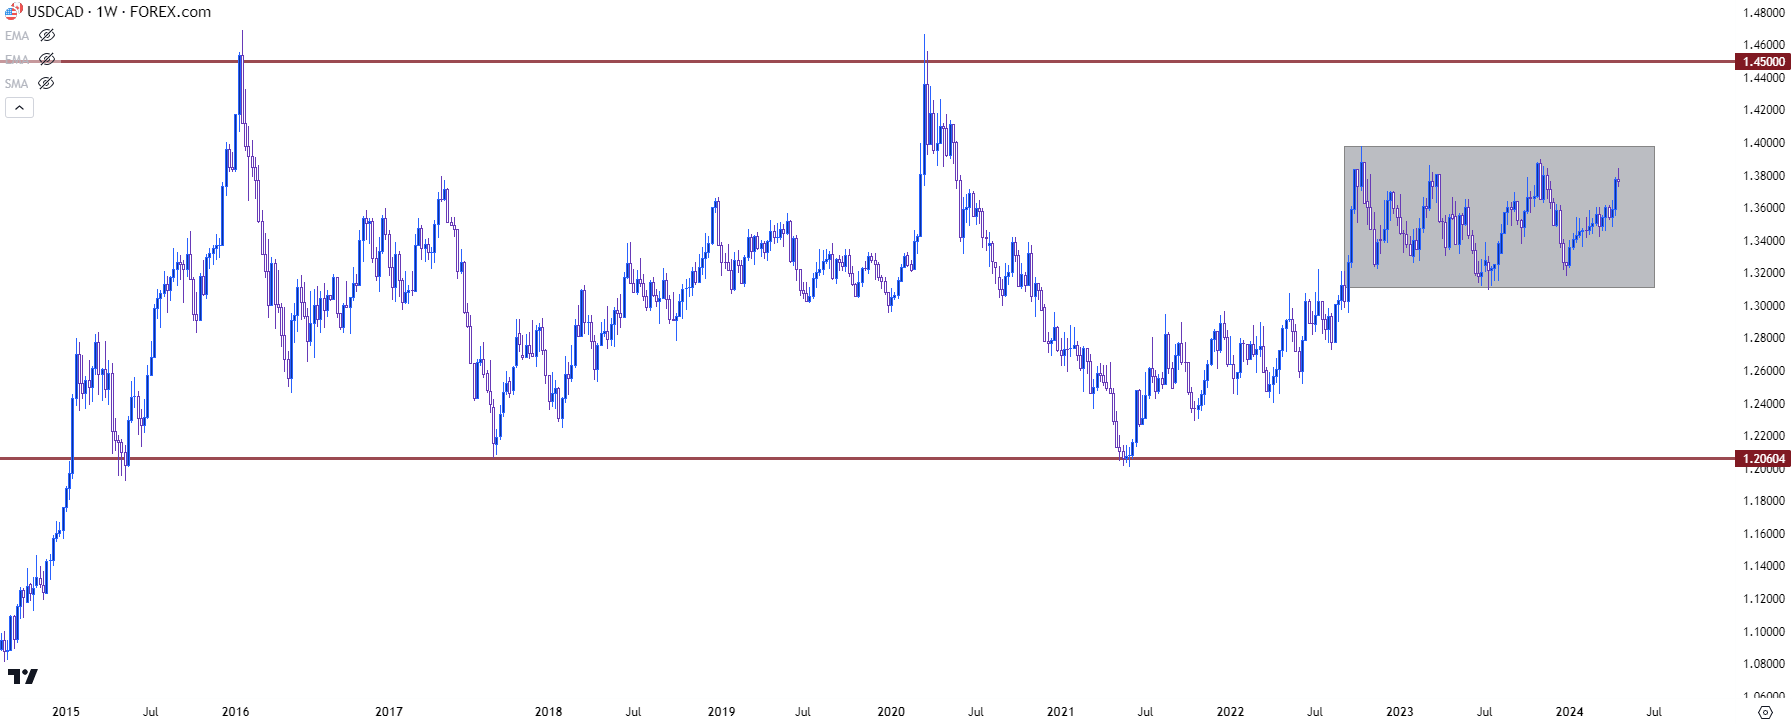
In USD/CAD, we have two different ranges. The first range is a big one as it spans all the way back to 2015, and there’s been support around the 1.2000 handle and resistance around 1.4500. The latter price last traded during the onset of the pandemic; while the former was last in-play after the hefty monetary response from the Federal Reserve drove the USD to fresh lows into the 2021 open.
USD/CAD Weekly Price Chart
 Chart prepared by James Stanley, USD/CAD on Tradingview
USD/CAD Shorter-Term
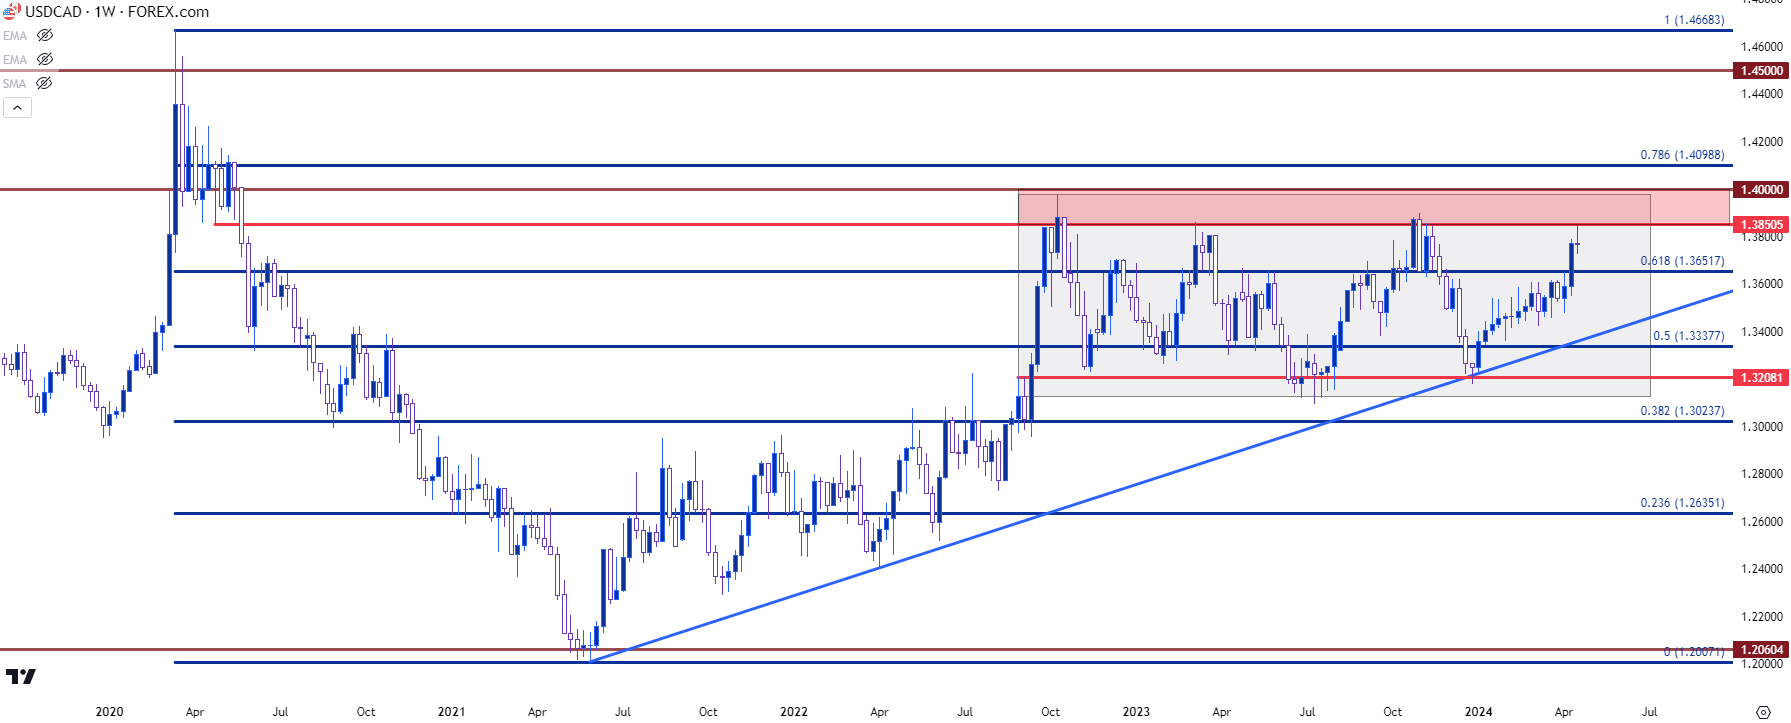
On a shorter-term basis there’s another range that’s been in-play, and I highlighted that in the grey box above. This one is tighter, and it’s been in the equation since Q4 of 2022 which is around the time the Fed started to cool rate hikes down from the 75bp hikes that they were pushing in the summer of that year.
This range is tighter, with support around the 1.3200 level and resistance as taken from a prior spot of support, from back in 2020 as the pair was starting to break down with the force of FOMC stimulus. I’m tracking that resistance from around 1.3850 up to the 1.4000 handle.
It’s already been in-play a couple of times since its initial appearance in Q4 of 2022, with a test in March of last year (as the regional banking crisis in the U.S. was coming to light) and then again in October, just before the USD began to sell-off on the back of the Fed sounding really dovish at the November 1st rate decision.
The pullback from that found support at a bullish trendline taken from 2021 and 2022 swing lows, which was confluent with range support at the time, and that’s led to a bounce right back up to range resistance.
USD/CAD Weekly Price Chart
 Chart prepared by James Stanley, USD/CAD on Tradingview
USD/CAD Breakout Potential
We saw a recent episode of this with USD/JPY, where a resistance level that had held for a while yielded to a strong breakout once price was able to take out the highs. And a similar scenario may take place in USD/CAD, but there’s a lot of overhead resistance that bulls will need to chew through and the statement can be made that resistance runs all the way up to the 1.4000 big figure.
And at that point, another issue with natural crosses comes into play and that’s from the cross-border hedgers and producers; who normally aren’t currency speculators but if they do have a need for both USD and CAD in business operations, they’re often at least aware of the spot price. And a test below 1.2000 or a test above 1.4000 can furnish expectations for ‘cheap’ or ‘expensive,’ which can then compel action that could further reinforce support or resistance from the psychological level.
But – that doesn’t mean that the pair can’t breakout. It just means there could be even more context for resistance to show at major levels.
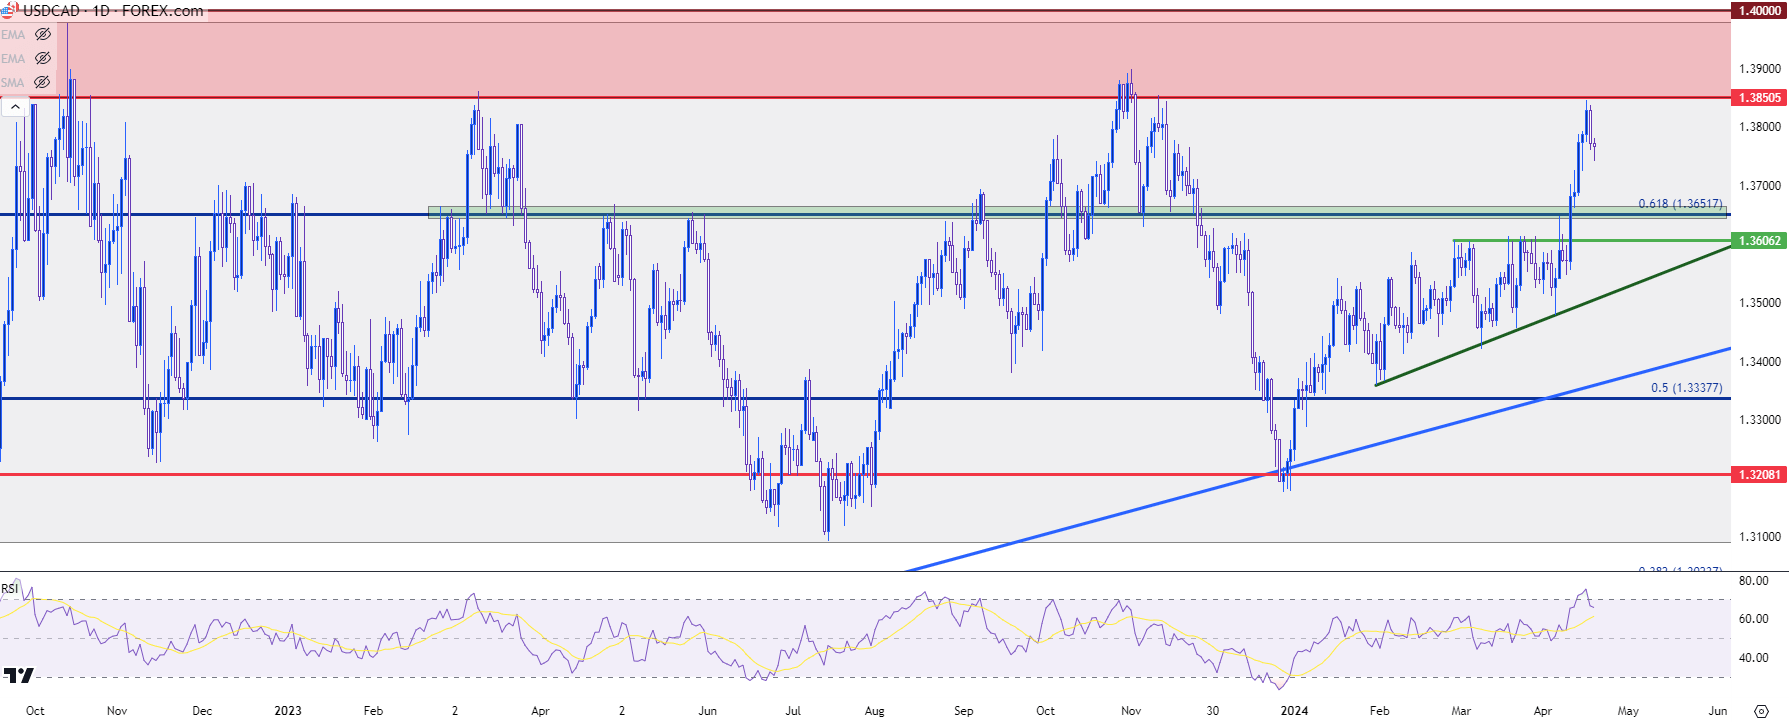
With that said, USD/CAD just saw a bearish cross from RSI on the daily, which may be enough to urge patience from bulls. This can put focus on pullbacks for higher-low support, so that if buyers are able to drive a deeper move into that resistance zone from 1.3850 up to 1.4000, there may be the ability to drive even deeper into the longer-term range, towards 1.4500.
For support, there is an area of interest, and that’s the 1.3652 Fibonacci level that’s been in-play numerous times over the past couple of years. Below that, there’s the 1.3600 level that held resistance for about a month before the CPI-fueled breakout took over.
USD/CAD Daily Price Chart
 Chart prepared by James Stanley, USD/CAD on Tradingview
--- written by James Stanley, Senior Strategist


